Hi there!
Here we go! Data news digest for the past week. Hope you’ll enjoy these findings.
Data Analytics
Tableau Conference 2024
Keynotes Summary from Tableau Tim
Main Product Innovations, like
- Local file save with Tableau Public – smth we’ve been dreaming of for a long time
- More advanced visuals with Viz Extensions
- Figma to Tableau Plugin by Tristan Guillevin & Jessica Bautista
The Dunning-Kruger Effect is Autocorrelation
The shocking truth about the tendency for unskilled people to overestimate their competence which in reality is just an autocorrelation! Learn more.
Success story from Airbnb on how they quantify brand perceptions from social media platforms through deep learning.
Data
- Operationalizing Data Quality: The Key to Successful Modern Analytics
- Modeling Slowly Changing Dimensions
- How to Build Tailored Enterprise Chatbots at ScalePython
- 5 Simple Steps to Automate Data Cleaning with Python
- Demonstration of Principal Component Analysis
- Introducing Tapyr: Create and Deploy Enterprise-Ready PyShiny Dashboards with Ease
- The Elbow Method for Determining the Number of Clusters in K-Means
Visualization
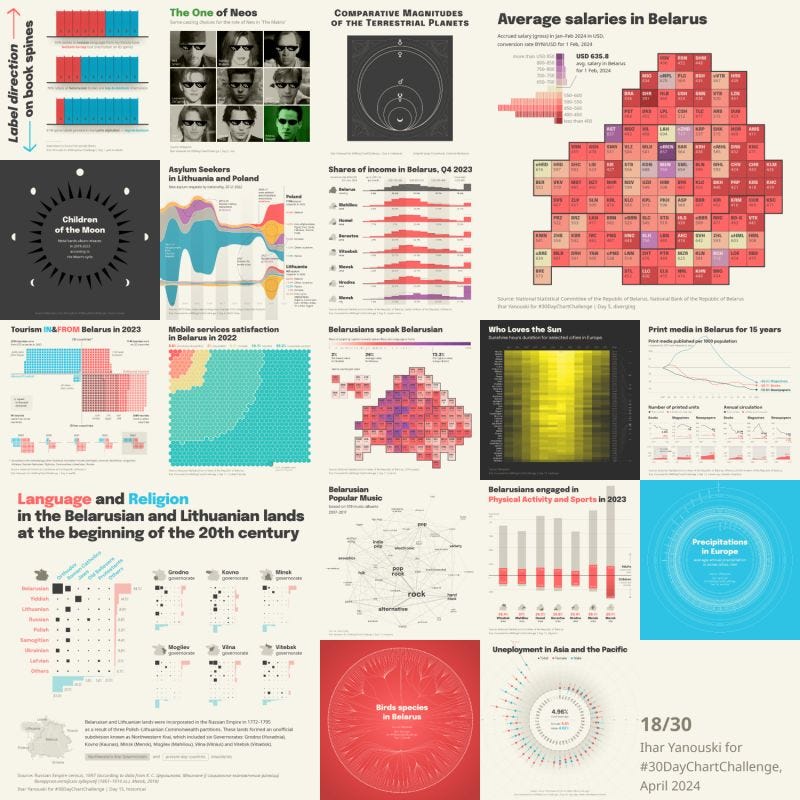
Results of the #30daychartchallenge
Dive into the results of the annual 30-day chart challenge in all social networks.
Don’t forget to participate next year in April! More info
Look at the results from:
Ihar Yanousky (photo below)
Cedric Scherer (author of the challenge)
and many others! All the works are absolutely beautiful!
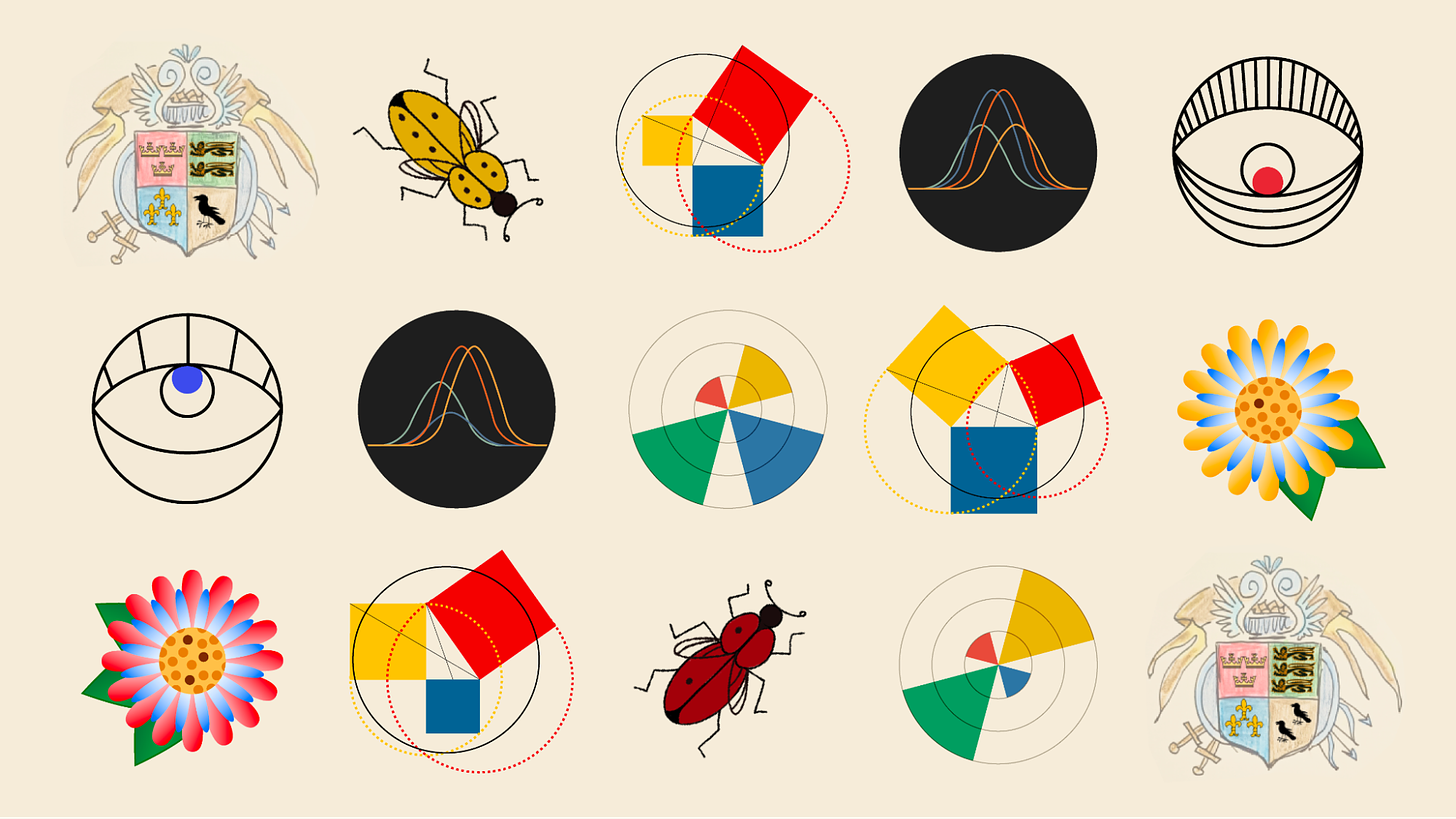
Results of the wonderful community project started by Natalia Kiseleva. Each small block on the picture below – participant’s visualization of this community's characteristics. Nice Data Art techniques and truly inspiring vizzes.
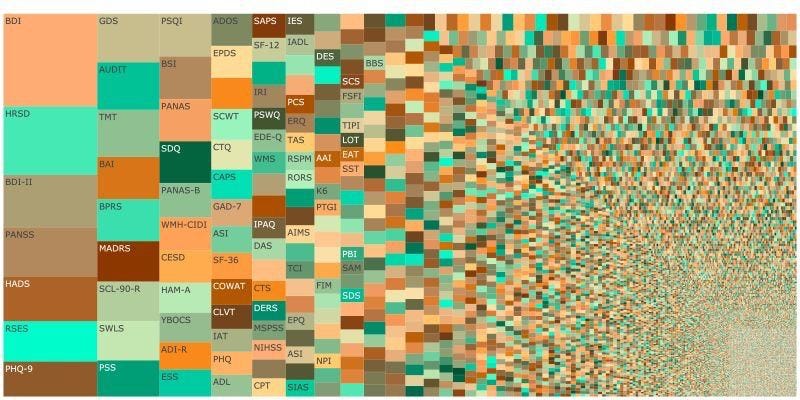
Treemap of Psychological constructs and measures
Great visual representation of how the psychological field is fragmented. More than half of the presented data psychological measures have never been used outside of the paper that introduced them!
The Flipbook Experiment by Pudding
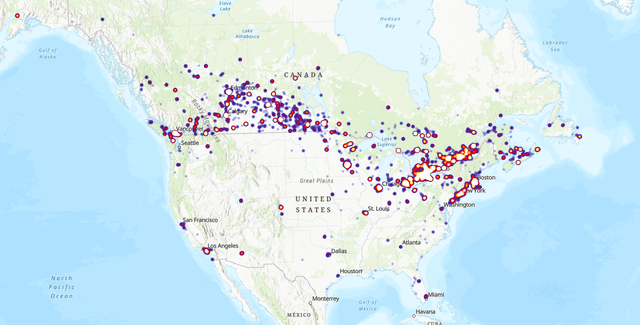
The Pudding conducted a social experiment and asked people to trace the previous person’s drawing to make a flipbook-style animation.
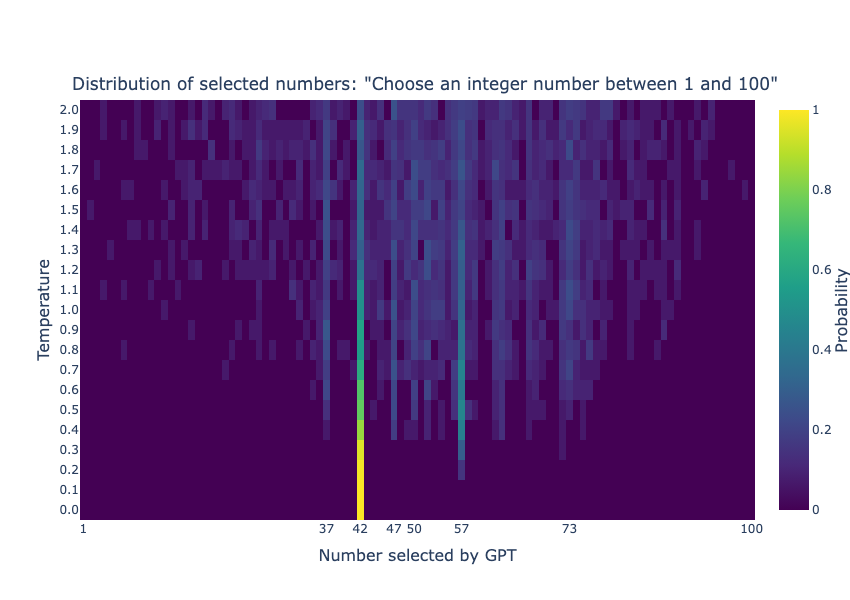
A bit of Douglas Adams vibes. What number ChatGPT would tell you if you ask it for a random number.
Tableau Picks
Findings
Streamlit – to create web apps in Python. You can also create dashboards with it.
Education
Meta Data Analyst Professional Certificate
Data Analytics course from Meta.Getting Started with PyTest: Effortlessly Write and Run Tests in Python
PyTest is a Python package that simplifies the process of writing and running test cases.Free Python Resources That Can Help You Become a Pro
List of Python courses, books, projects, cheatsheetsLearning Path: Shiny
A set ow workshops to master shiny skills.


