


sunday-ta
This Week's Highlights: May 27th - June 2nd

Don’t forget to check out Data Viz Tips section – tables history, time series data visualization types and some data analysis tips!
Data Visualization
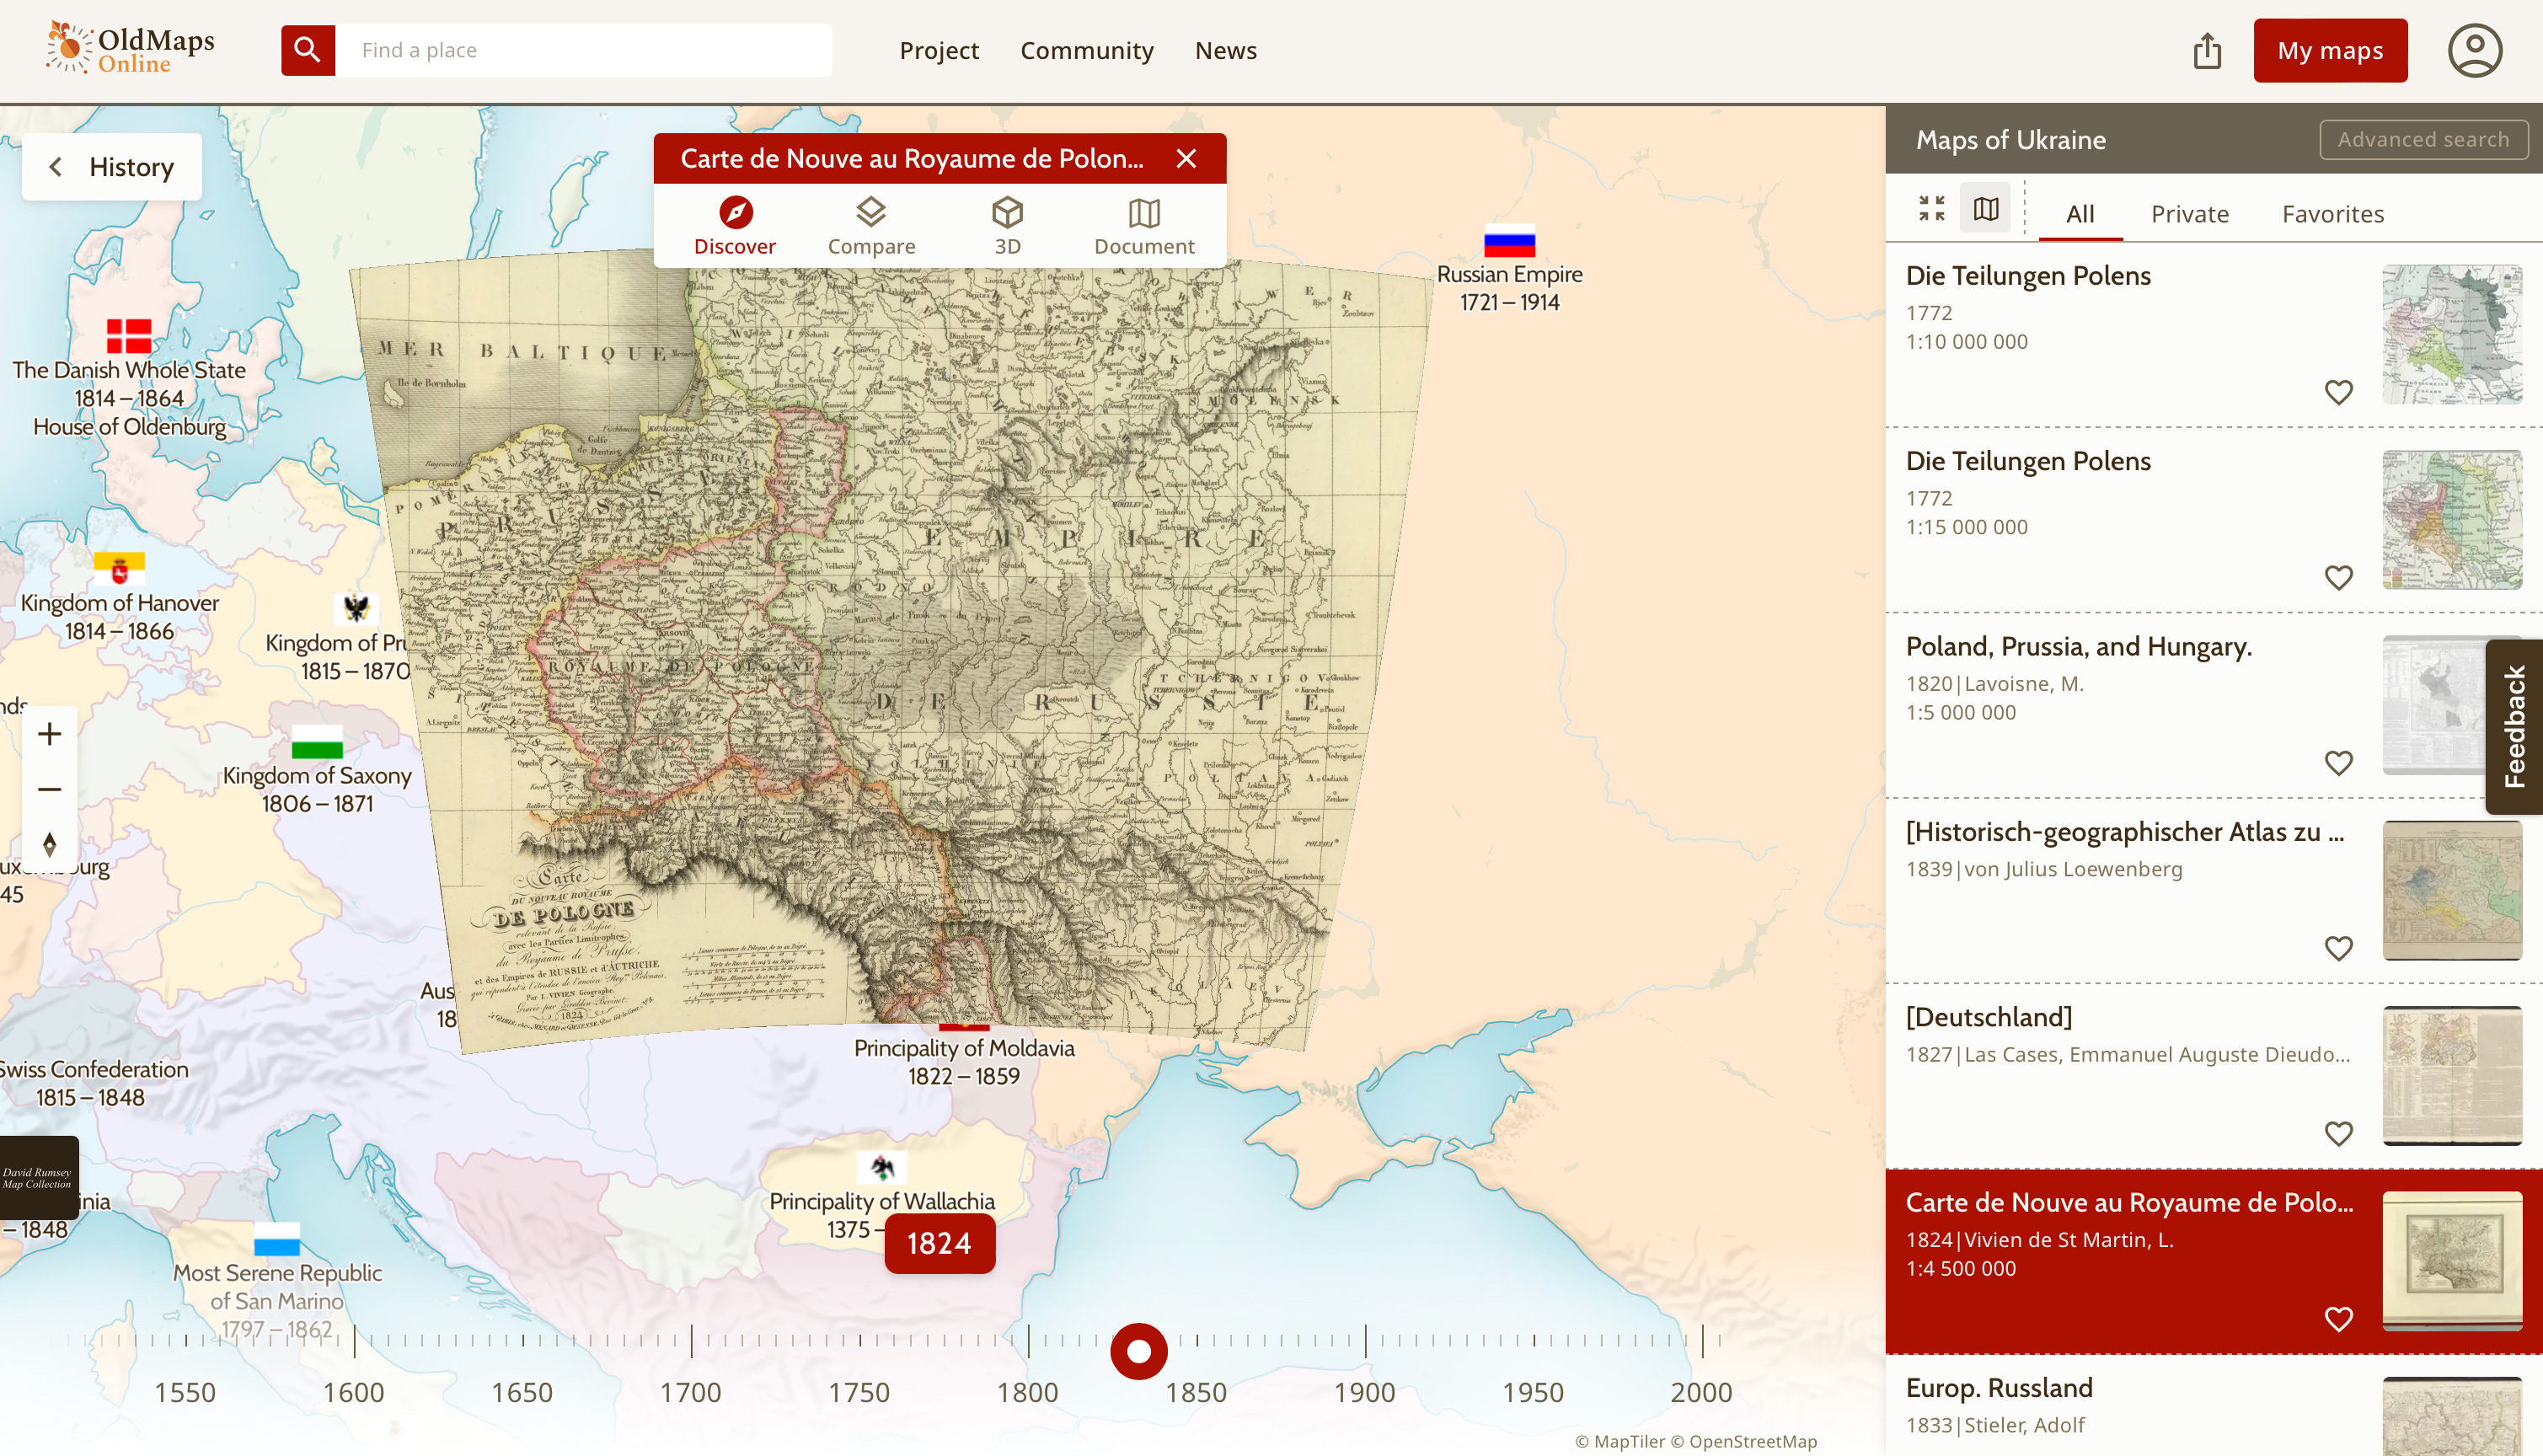
TimeMap.org – interactive map of history


Iraq's population density in 2022 by Milos Popovic

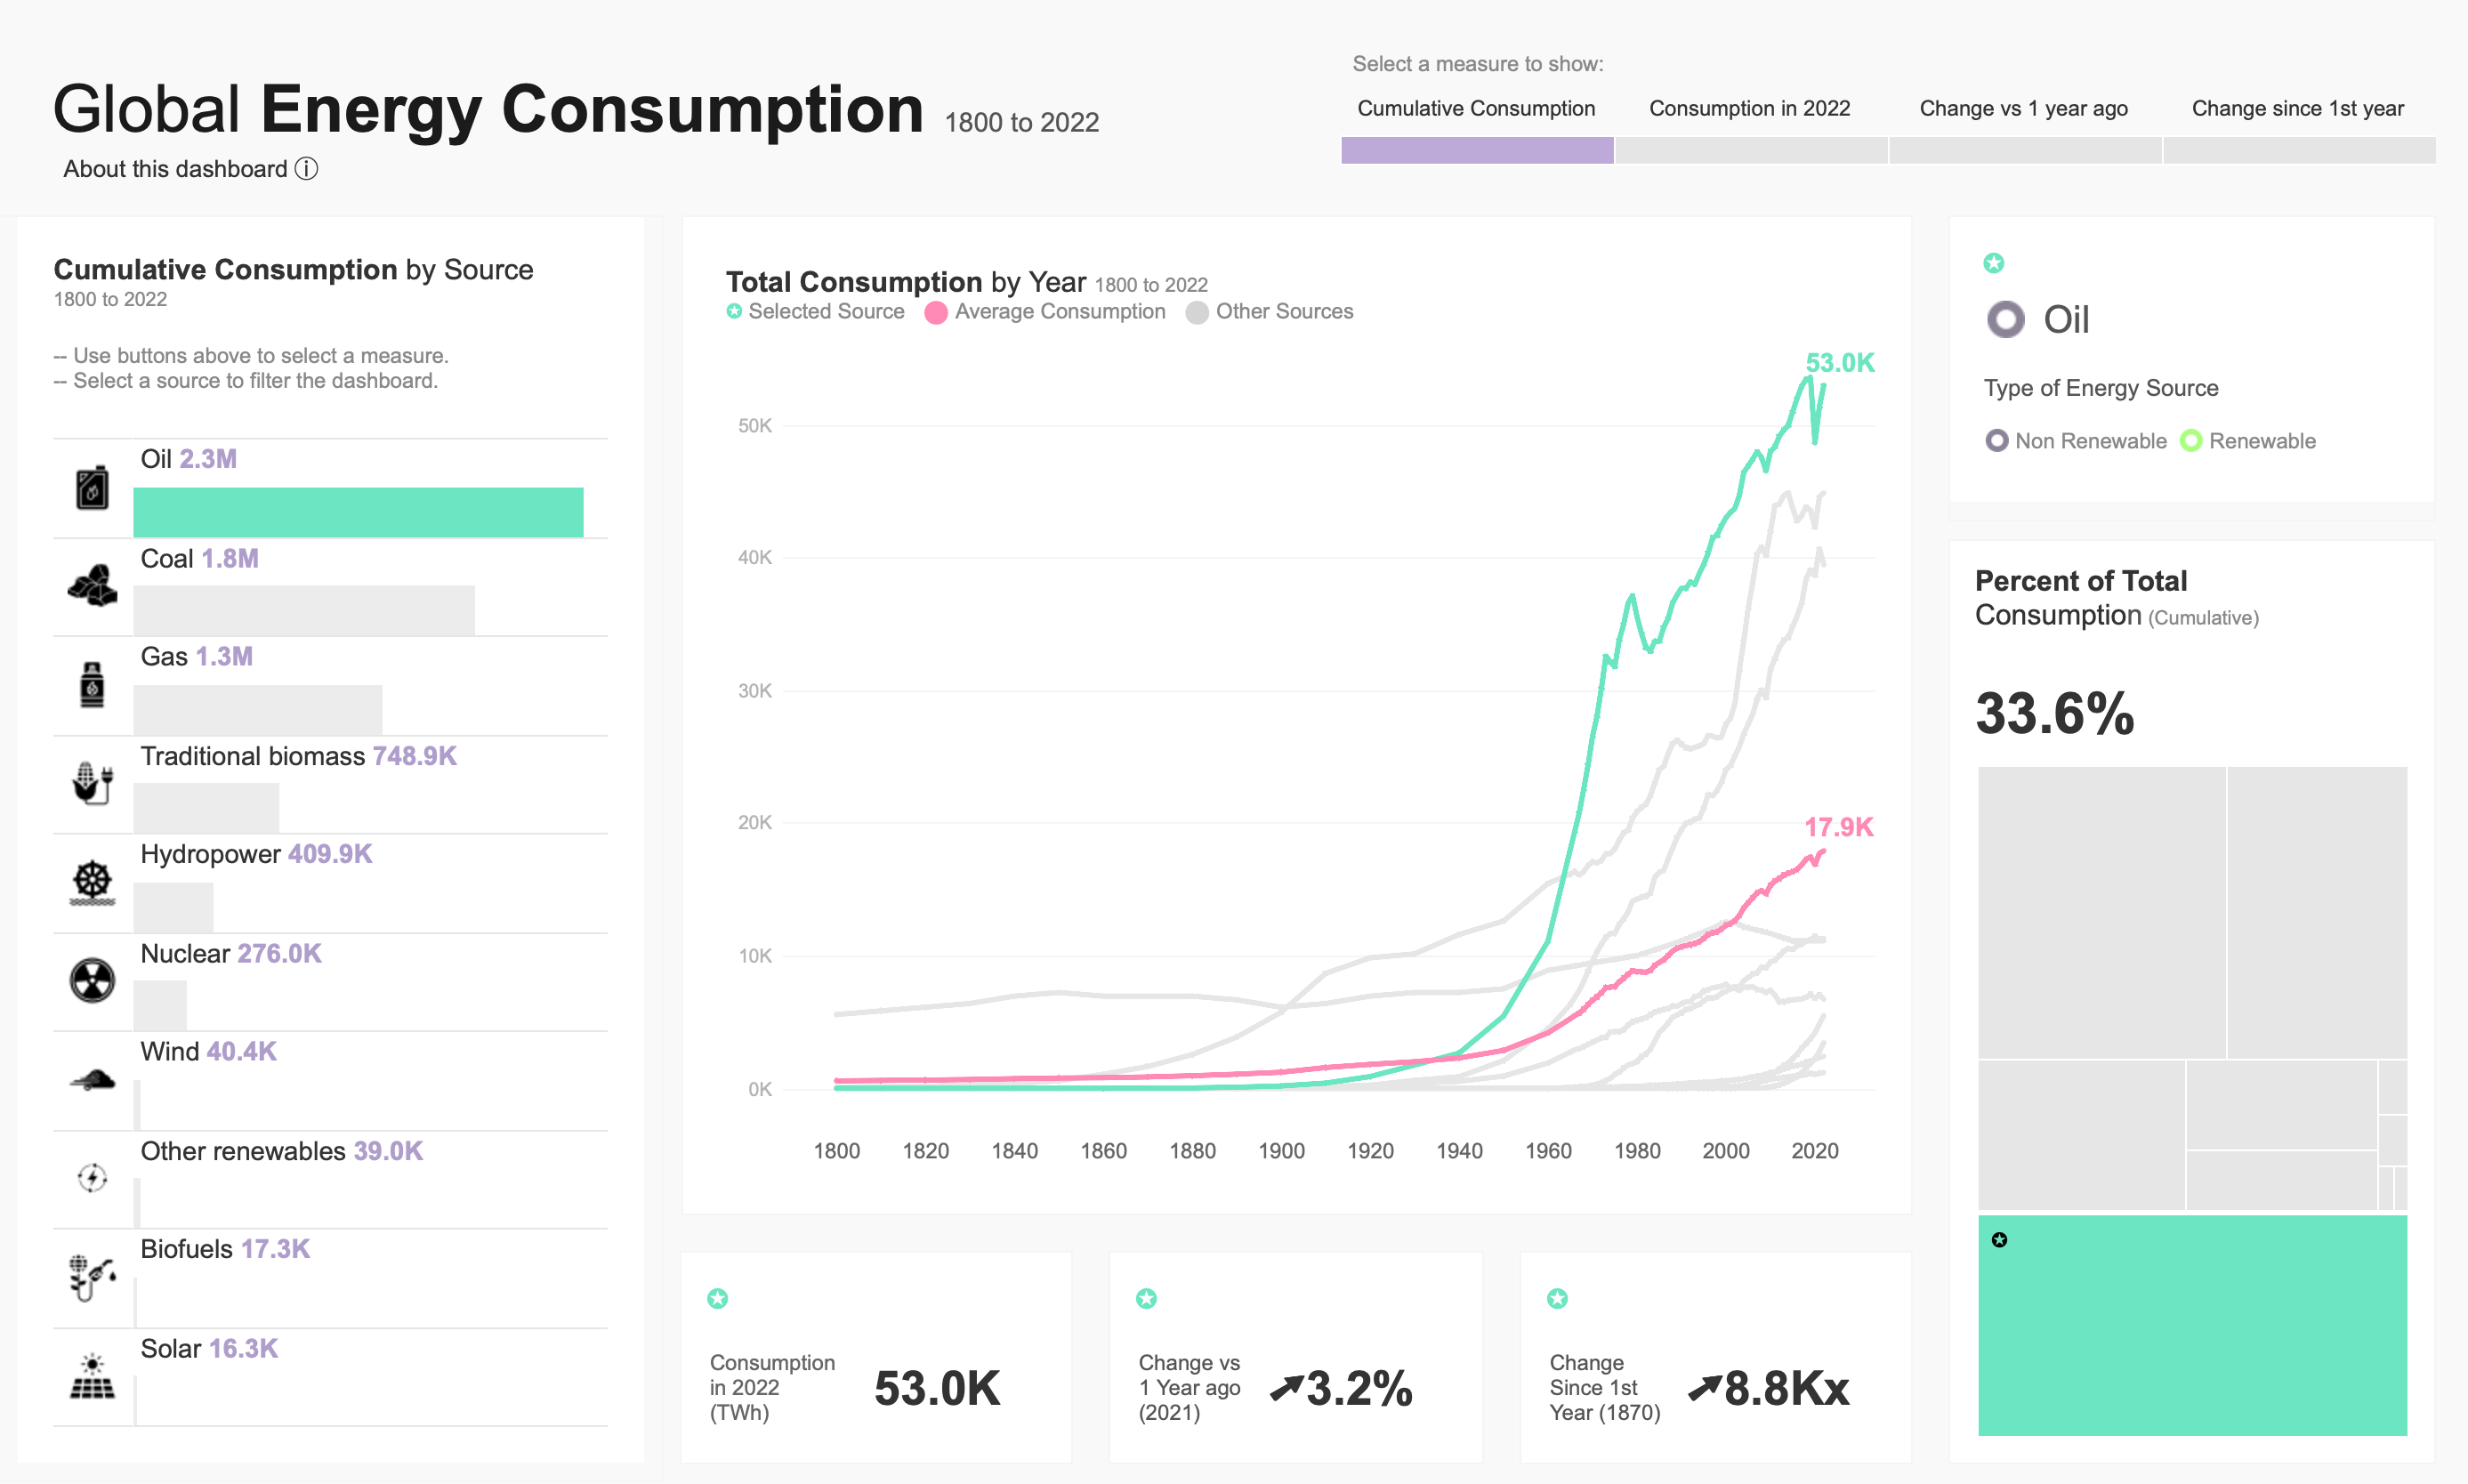
[Tableau] Global Energy Consumption | Analysis focused by Chimdi Nwosu

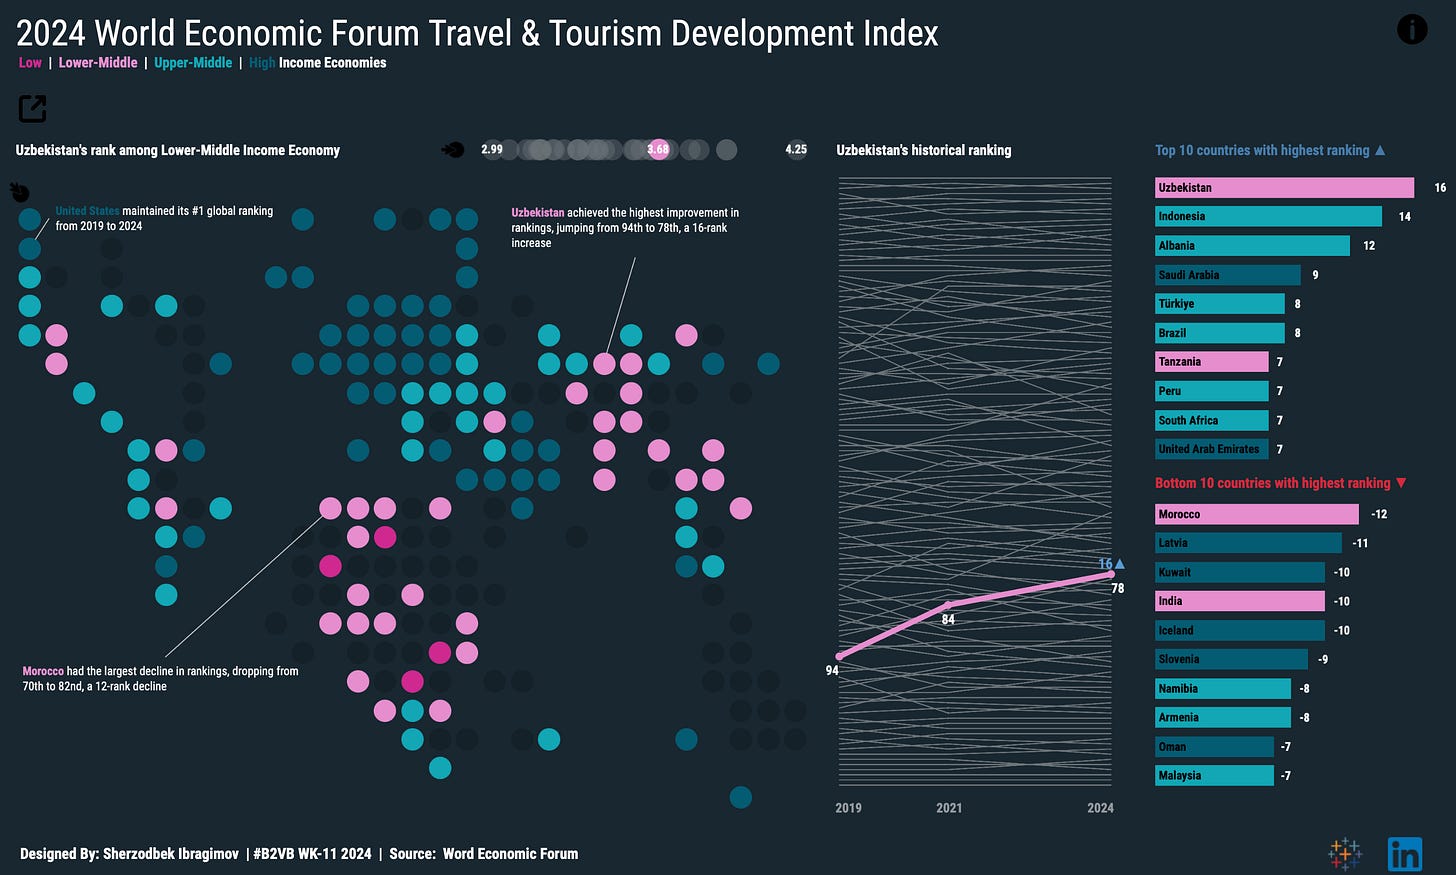
[Tableau] 2024 World Economic Forum Travel & Tourism Development Index | #VizOfTheDay #VOTD by Sherzodbek Ibragimov
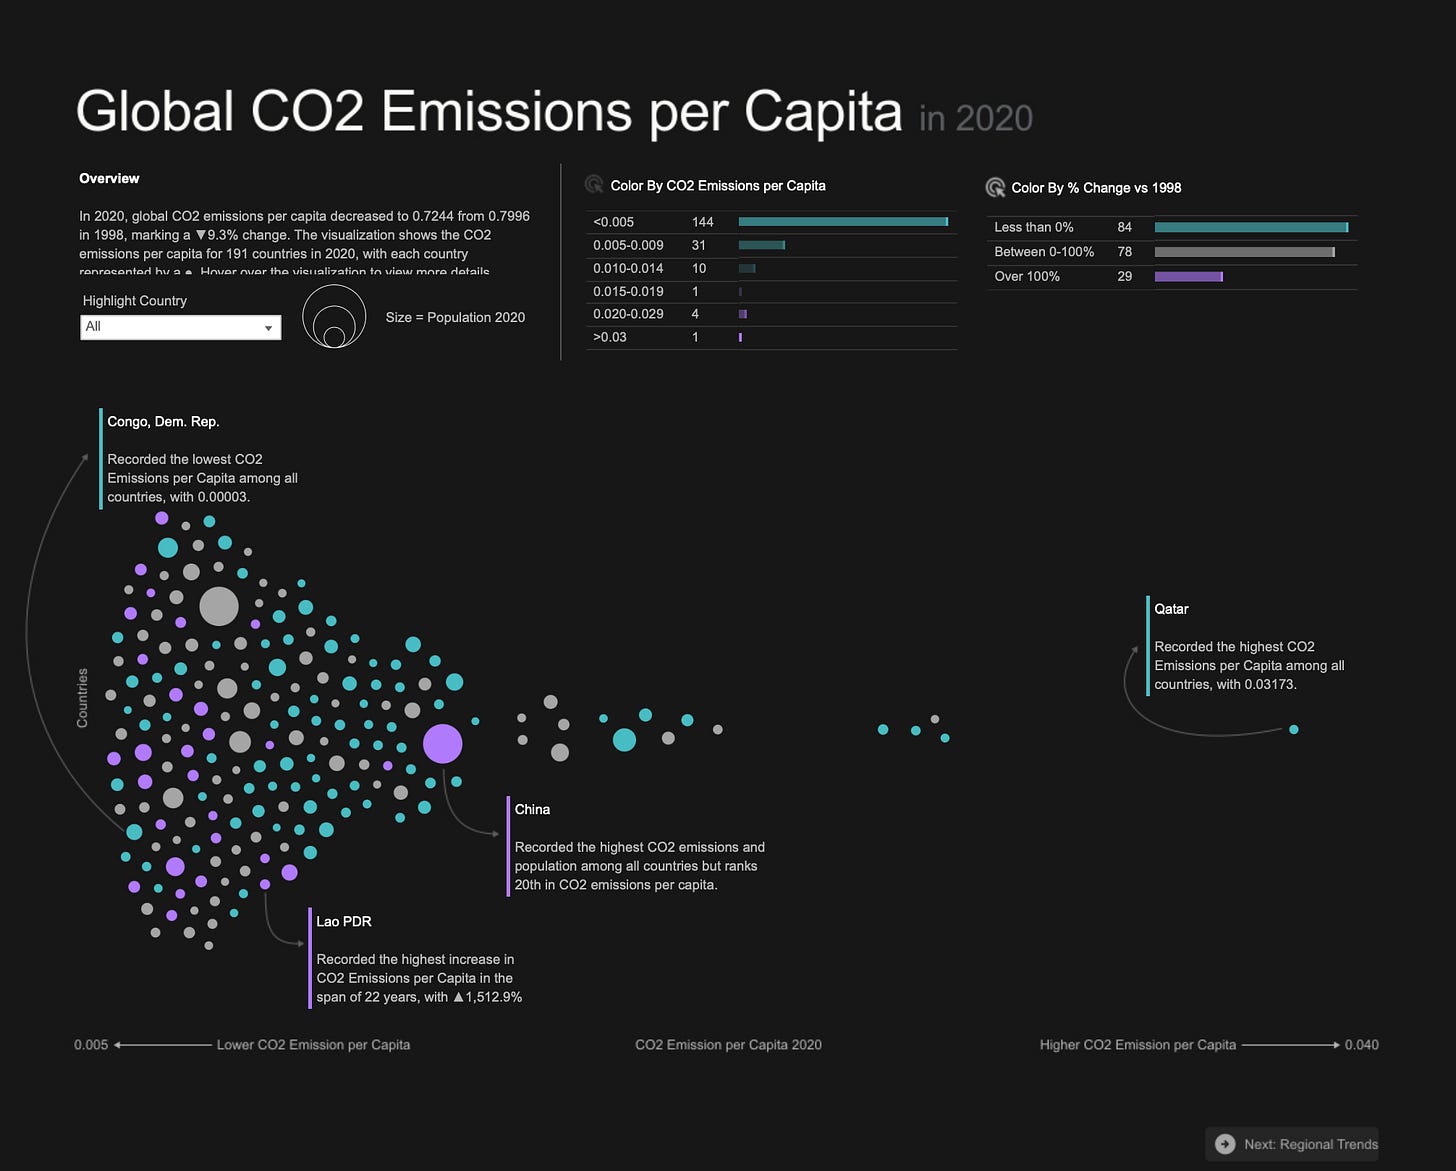
[Tableau] Global CO2 Emissions per Capita in 2020 by Ervin Vinzon
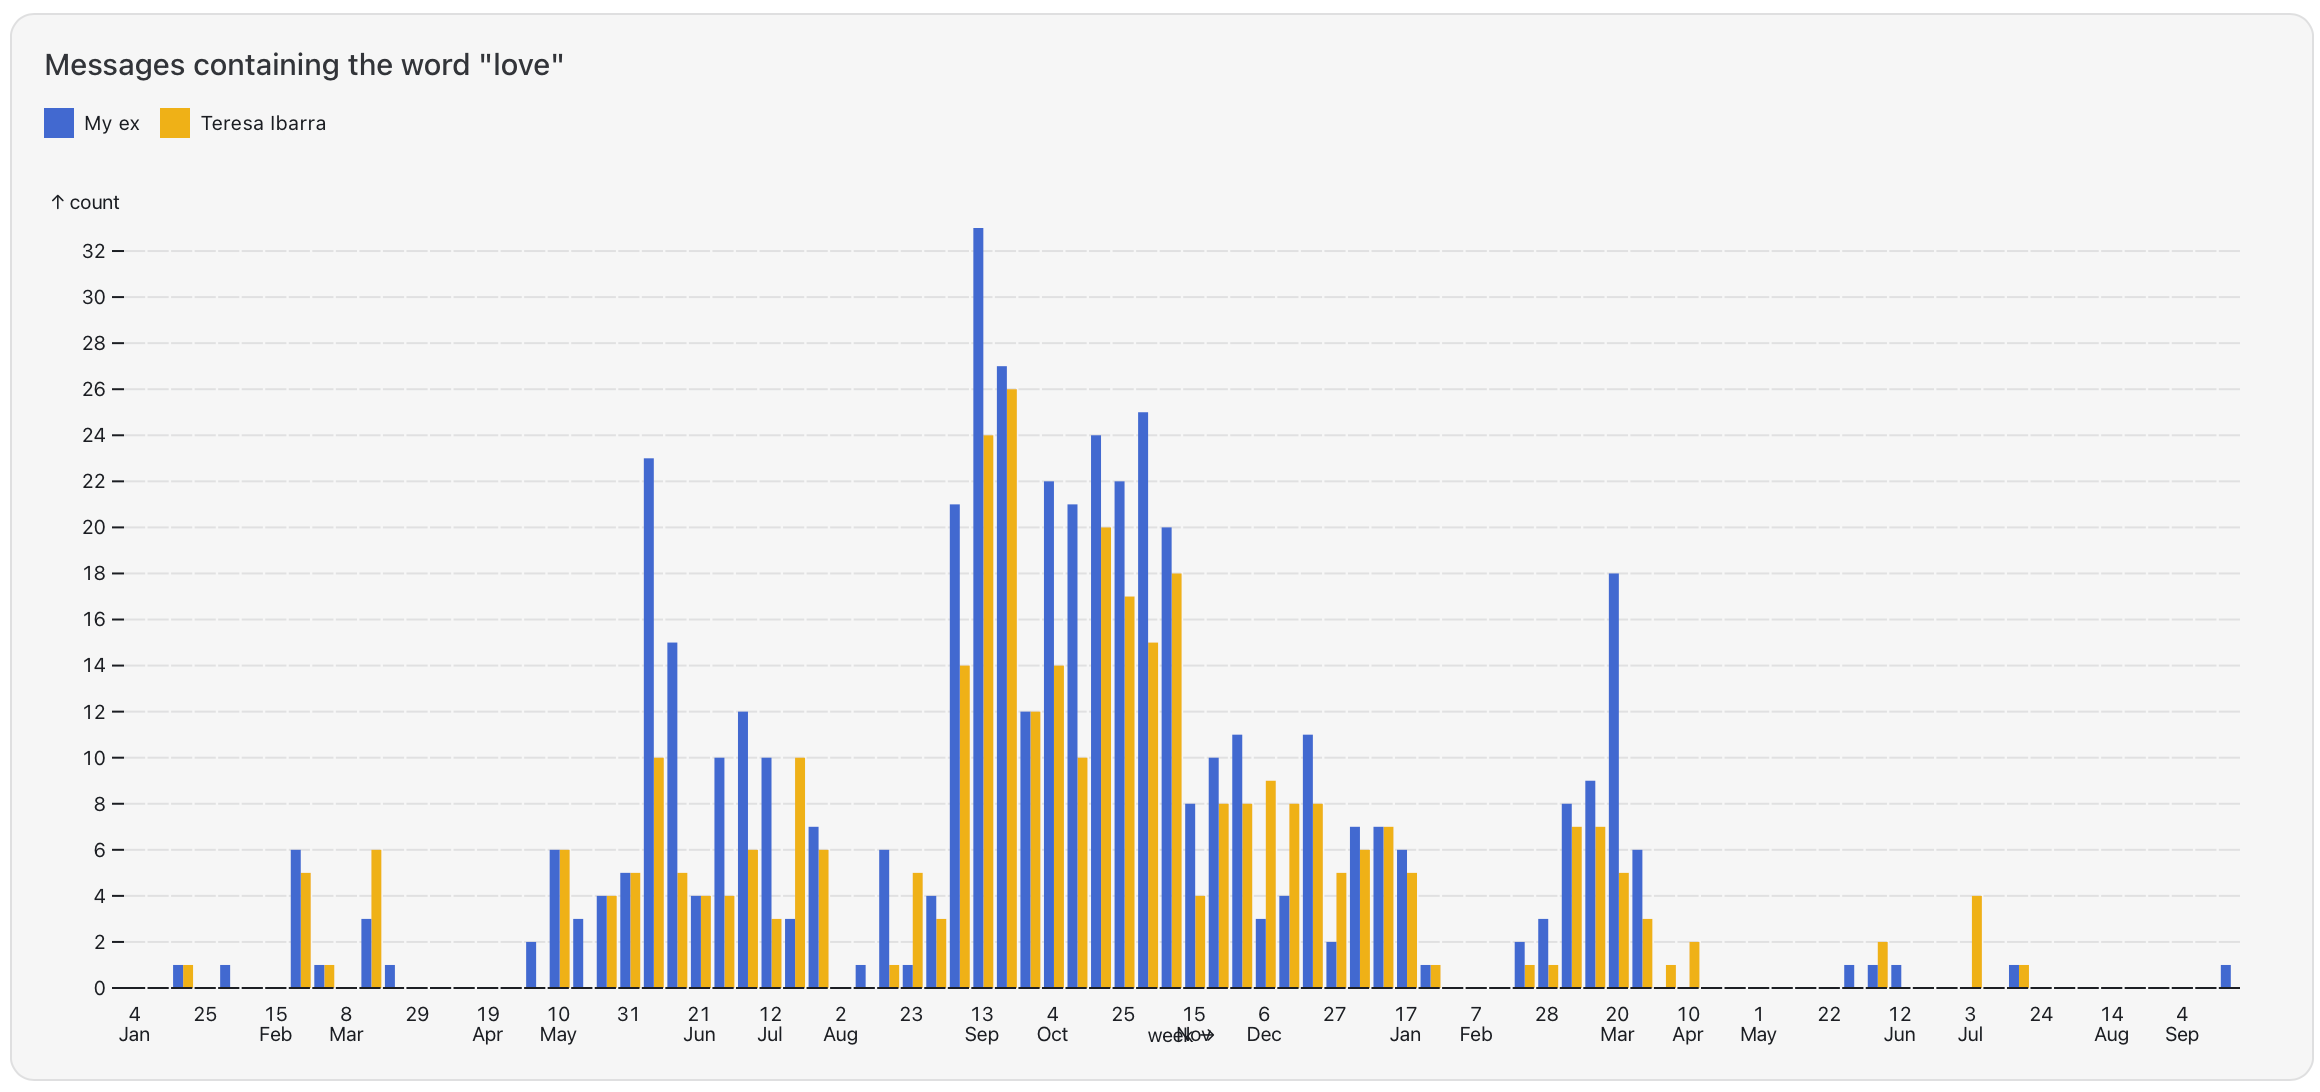
Analyzing my text messages with my ex-boyfriend by Teresa Ibarra


🎓 BI, Data Viz Tips
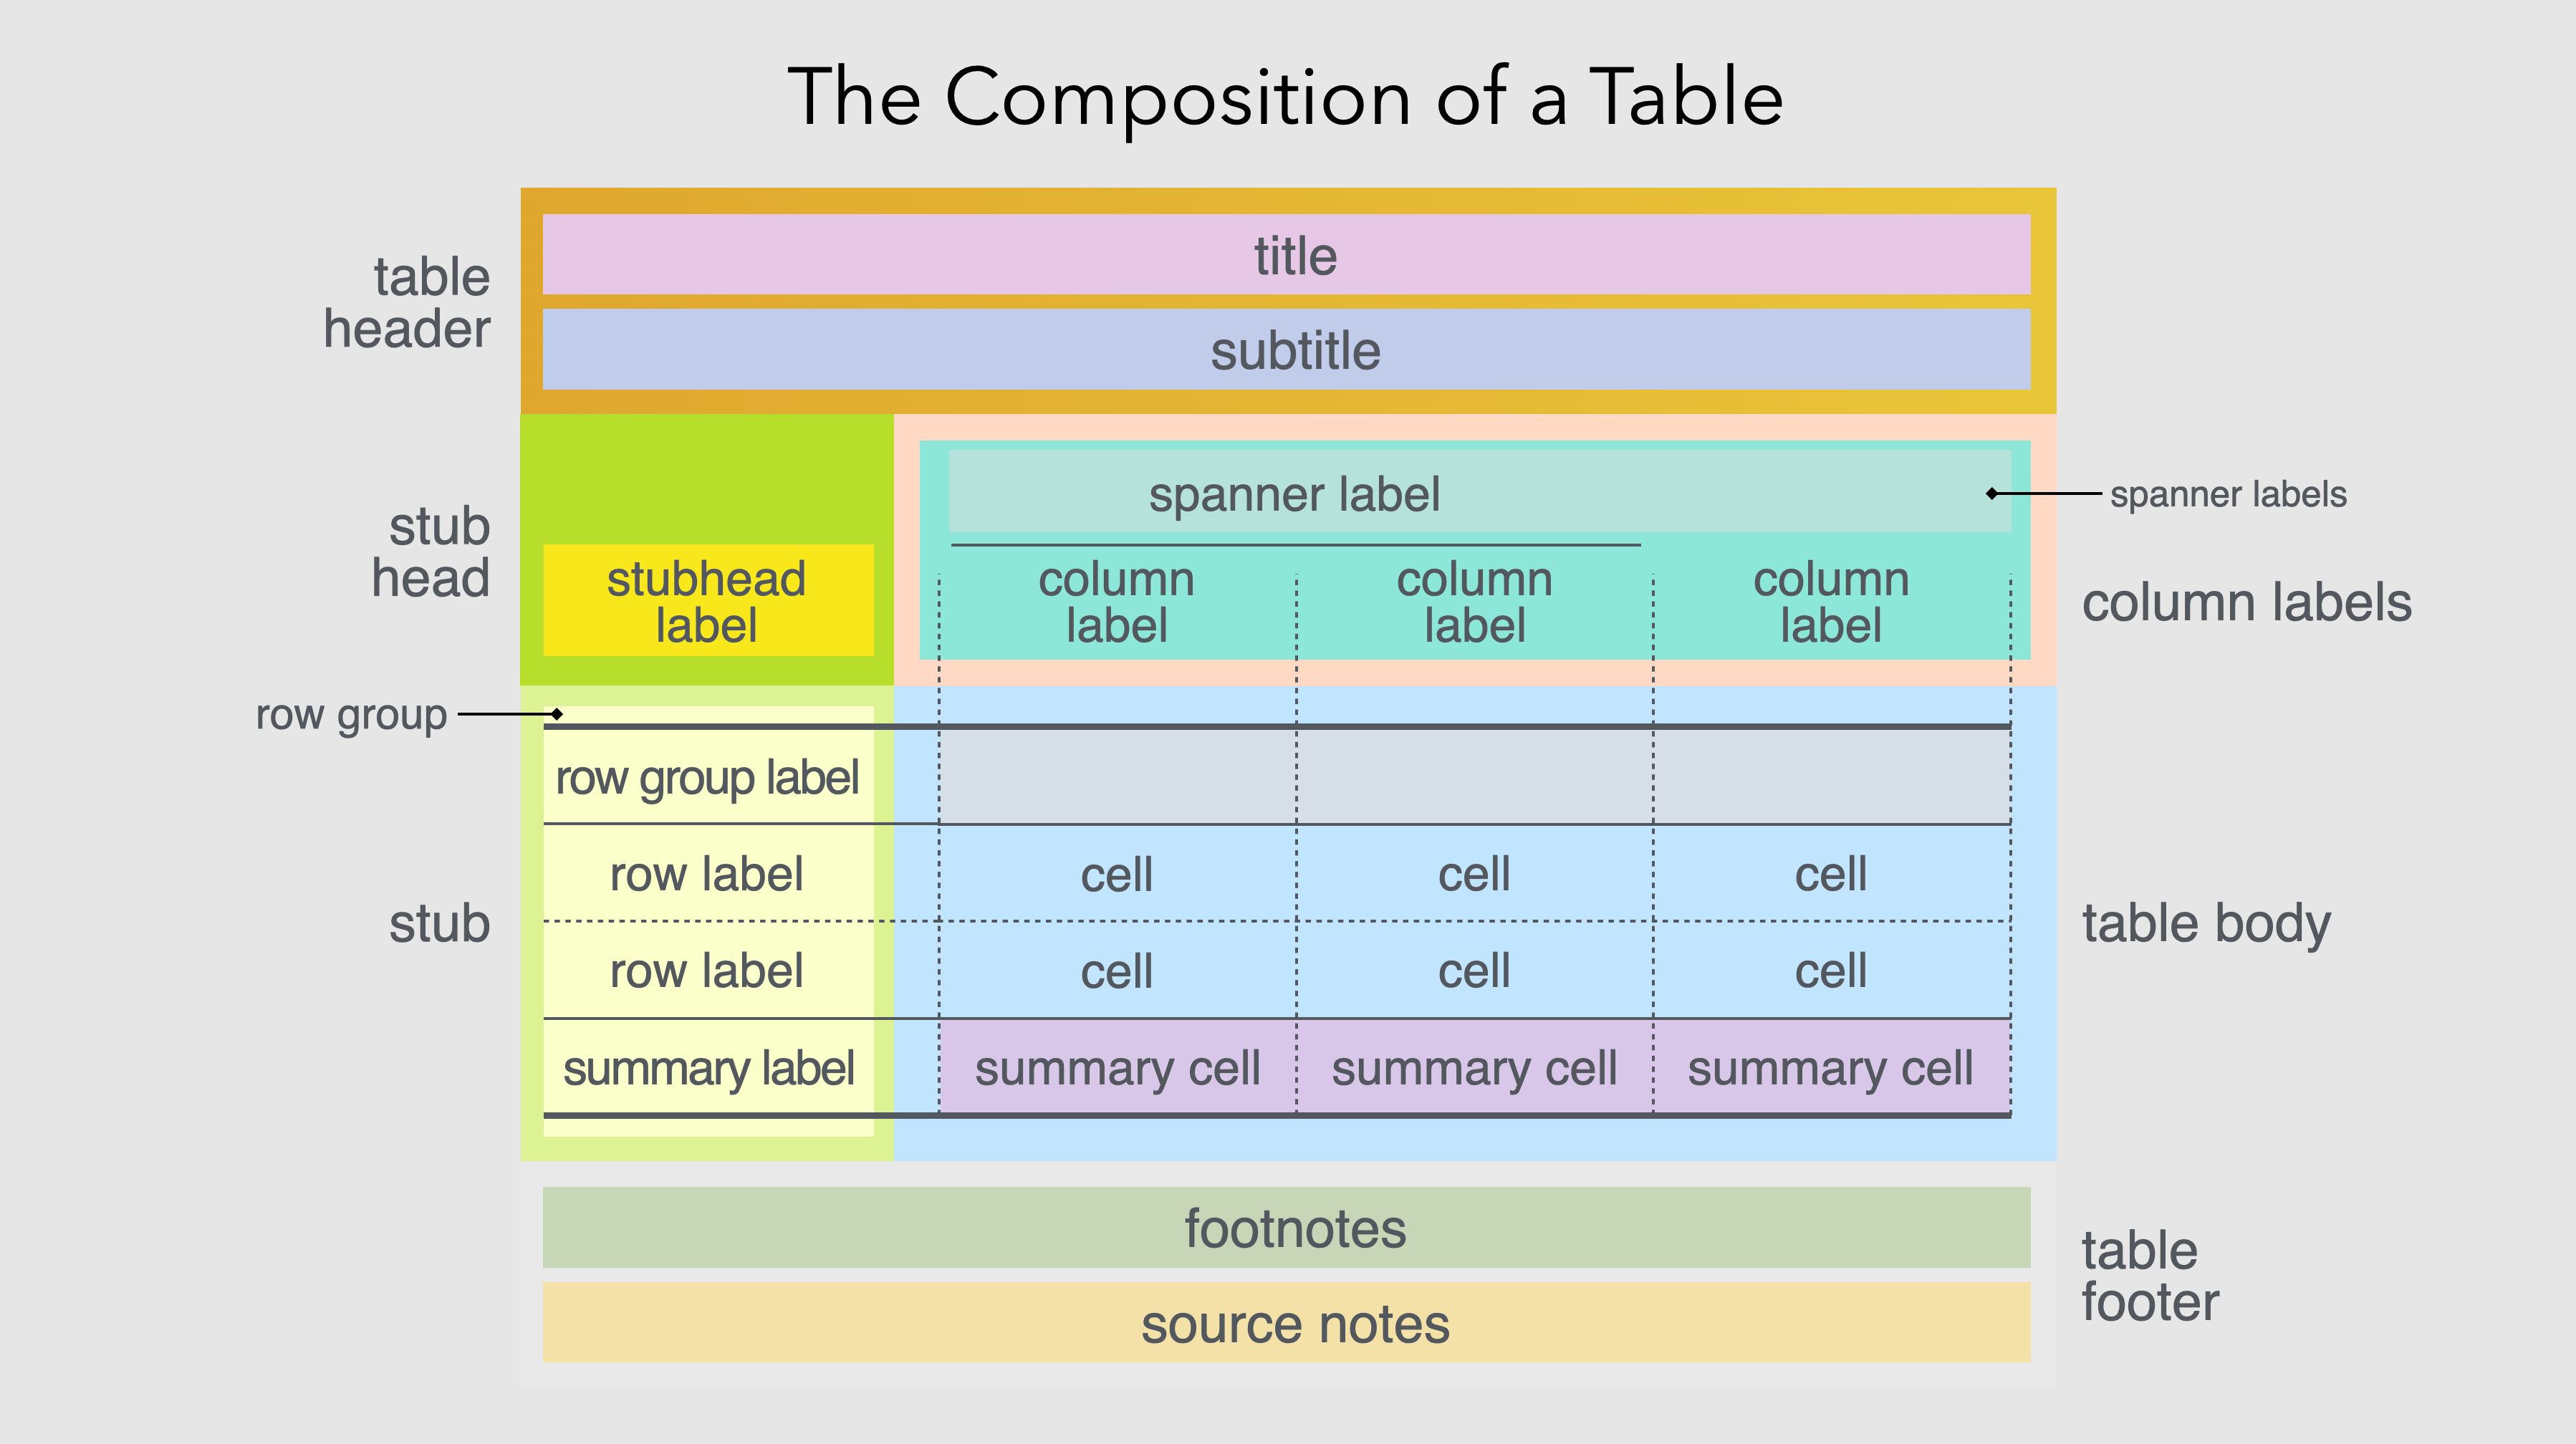
The Design Philosophy of Great Tables in Posit blog

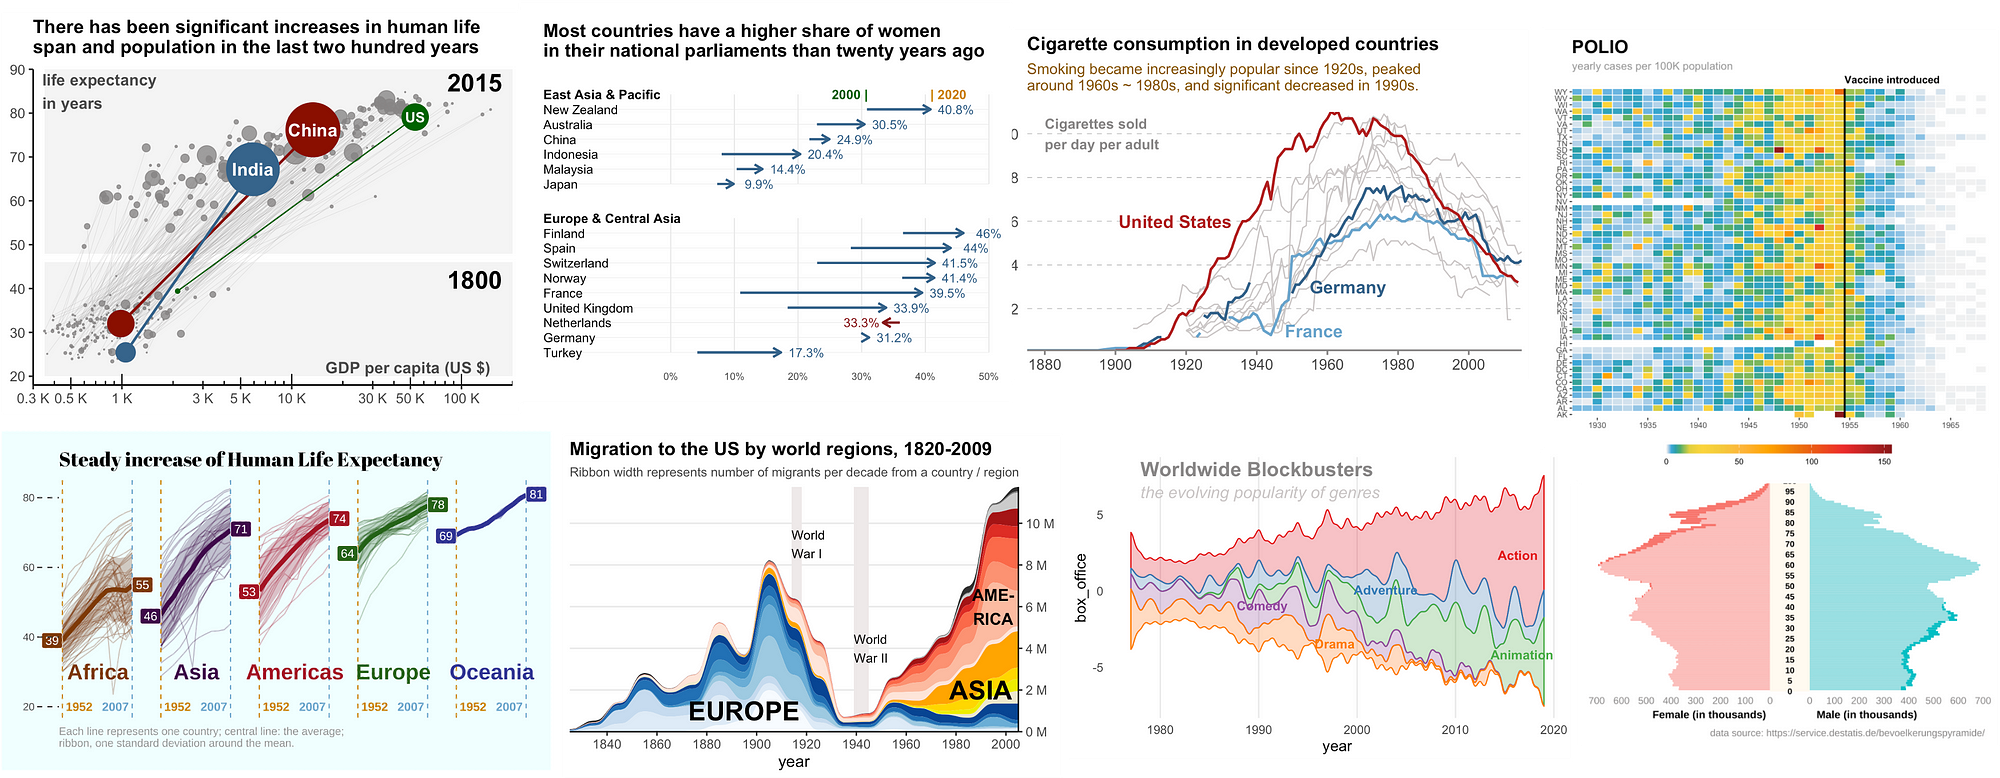
[Dataviz] Awesome Strategies to Visualize Change with Time by Bo Yuan
[Power BI] Numerro — toolkit for prototyping in Power BI
[Tableau] Tableau Specialist Certification Guide: 150 Questions Bank by Prasann Prem
[Tableau] How I Design an Actuals vs Target Chart by Kevin Flerlage
[Tableau] Custom Dynamic Legends in Tableau by Lindsay Betzendahl
[UX] Enhancing your design skills by adding more dots in UX Collective
🎓 Data Tips
[Data] Enhancing data lineage and metadata management in ELT pipelines in Data Science Central
[Statistics] Outlier Detection Methods by Matt Dancho

[Statistics] What is a percentile rank? by Allen Downey
[SQL] Top SQL Queries for Data Scientists in KDNuggets
[SQL] SQL Explained: Normal Forms in Towards Data Science
[AI] Exploring Google’s Latest AI Tools: A Beginner’s Guide in KDNuggets
[R] Easy data cleaning with the janitor package in R-Bloggers

Findings
Yi Zhe Ang blog about data science and data visualization
WildChat – a corpus of 1 million real-world user-ChatGPT interactions