How can you make a BI harder and useless? In BI development, waste refers to inefficiencies that slow down the process, reduce value, or lead to unnecessary effort.
Reducing waste in BI development requires a mix of process improvements, automation, and better collaboration. Here are effective strategies to minimize waste across different areas.
🚨 1. Disconnected BI Teams
BI teams often work in isolation from data engineers, analysts, and business users, leading to duplication and misalignment. As a result, people create dashboards that already exist, develop redundant data sources, and build solutions that business users don’t actually need. I had this problem and learnt one thing – communication is a key!
✅ Fix:
Encourage cross-functional collaboration between business, data engineering, and BI teams. Form a cross-functional BI governance group with representatives from business, data engineering, and analytics. Schedule regular meetings and share the outcomes with all stakeholders. It would work even for BI developers only. We used to have regular BI dev meetings to share our latest results.
Assign clear ownership for dashboards, datasets, and metrics. Make owners responsible for promoting their assets and ensuring consistency across BI products. Emphasize the importance of alignment to avoid redundant or conflicting data solutions.
🚨2. Overly Rigid BI Governance
Do you remember the last time you had to access some report or data? How hard was it to do so? Often strict access policies and bureaucratic approval layers slow down dashboard development and dashboard usage. If you can grant most of the access by default, do so.
✅ Fix:
Make sure the process of getting access is as seamless as possible, properly described, and clear to everyone.
Balance governance with agility – certify key datasets while allowing self-service BI.
Implement role-based access controls to maintain security without blocking workflows.
🚨3. Overproduction
BI teams create unnecessary reports and dashboards that no one uses. They develop dashboard for each request they are asked to.
✅ Fix:
Validate dashboard requests before development. Require stakeholders to justify why a report is needed and define expected usage. Make sure they are requesting metrics they can really influence.
🚨4. Keeping Unused Data & Reports
Very often BI teams keep every dataset and dashboard forever, slowing down queries and making dashboard systems cluttered. One of the first things I do after creating a dashboard is check if it’s actually being used.
✅ Fix:
Conduct regular audits – delete or archive unused datasets and dashboards.
Monitor dashboard and datasets usage and remove reports that are no longer used.
In Tableau you can use Admin Insights. Don't focus only on dashboards; monitor data sources and other analytical products as well.
🚨5. Overcomplications
Trying to add every metric possible makes dashboards cluttered and hard to use. I’d suggest to invest sometime in building metrics tree and understanding what really is important. Highly recommend this article about metrics by
.✅ Fix:
Metrics tree analysis for your organization. Focus on the most impactful KPIs first.
Use progressive disclosure – “overview first, zoom and filter, then details-on-demand”.
🚨6. Never-Ending Dashboard Tweaks
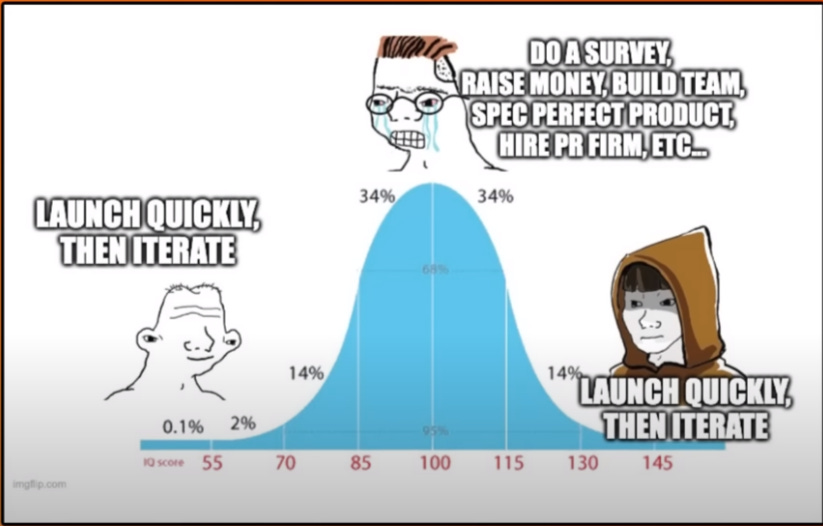
BI developers over-optimize visualizations, delaying releases. I plead guilty to this one. Sometimes I try to make it look perfect, but in reality, nobody needs that in the first iteration. Start with the MVP and don't forget to use dashboard templates to speed up development.
✅ Fix:
Ship Minimum Viable Dashboards (like an MVP) first, then iterate based on user feedback.
Set design guidelines to avoid endless discussions on chart styles.
🚨7. Endless Requirement Meetings
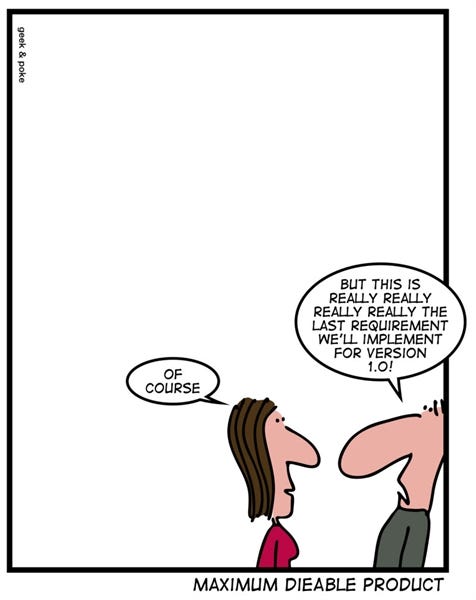
Sometimes stakeholders want to meet with you every day and every hour, continuously expanding the requirements they originally stated. Too many meetings with unclear goals lead to slow decision-making and scope expansion.
✅ Fix:
Set clear goals and define the scope of the BI project you're working on. Be explicit about what is not included in the scope.
Use prototypes and wireframes to validate requirements before diving into development.
Limit meeting frequency and prioritize asynchronous communication (Slack, Notion).
🚨 8. Overdocumentation
To be honest, I’m a pro-documentation person. It might not be used by many other stakeholders, but at least it’ll help you remember how you developed the dashboard. Of course, sometimes BI teams spend too much time documenting, but no one actually reads or maintains the documentation.
✅ Fix:
Keep documentation lightweight and searchable—use a business glossary with real examples. Don’t make it too big and re-link with other sources. I’ll promise to write a post about documentation one day.
🚨 9. Poor BI Infrastructure and Manual Work
I understand that the cost of switching systems is enormous, but staying on outdated ones can be even worse in the future. Slow, outdated BI tools and lack of proper version control lead to inefficiency. The same applies to automation; sometimes it feels that automation isn't required because manual work doesn’t take much time. Maybe it doesn’t now, but what about after a year? Manual processes can work as a one-time thing or as an MVP, but for the future, it’s better to automate them.
✅ Fix:
Invest in modern BI tools and modern data stack that support collaboration and automation. Consider Self-Service tools.
Use Git for version control.
Automate tasks with dbt or Airflow. Set up scheduled data refreshes to eliminate manual updates.
🚨10. Rushing BI Development Without Testing (Compromising Quality)
No data validation or automated tests, leading to inaccurate reports and broken dashboards. We used to have a QA engineer dedicated to BI and Data Analytics, and it was the best! She knew all the specifics about metrics and helped improve the quality of our data products enormously.
✅ Fix:
Automate data quality checks to catch missing or incorrect values early.
Compare data between dashboards to check for consistency.
🚨11. Unoptimized Data Models
Using raw transactional data instead of transformed data and optimized aggregates leads to slow performance and poor user experience on your dashboards. Think about the backend of your dashboard and keep it clean.
✅ Fix:
Use denormalized tables, materialized views, and caching for faster performance.
Aggregate data whenever possible.
Precompute common aggregations instead of running complex joins in real-time.
Don't include data you won't be using.
🚨12. Too Many Custom Metrics Without Standardization
Business users define their own KPIs, leading to conflicting definitions across dashboards. This brings us back to the importance of building a metrics tree within the organization.
✅ Fix:
Invest in building master data sources with the most commonly used metrics.
Establish a centralized KPI repository to ensure everyone uses the same calculations.
Use governed data models to enforce consistency.
Try semantic layers for building metrics.
Hope this was useful! Breaking BI silos requires both process and cultural changes. Start with ownership, communication, and governance, then focus on tool standardization and automation. Remember, your dashboards are just another product, and BI development is just another process to manage.


