Precipitation Anomalies, ROI of Data and Visual Stories
🚀 last week's useful matierials, dashboards and beautiful visuals

Data
Customer Segmentation Bible for Marketers and Growth teams by JetMetrics
Data/Sources Repo – data sources, public datasets, etc by Alexandre Bovey
The Data ROI Toolkit by Dataiku
Educational and Useful
The Key Elements & Principles of Visual Design by Teo Yu Siang
Top 10 Expert Tips to Boost Tableau Dashboard Performance by George Gorczynski
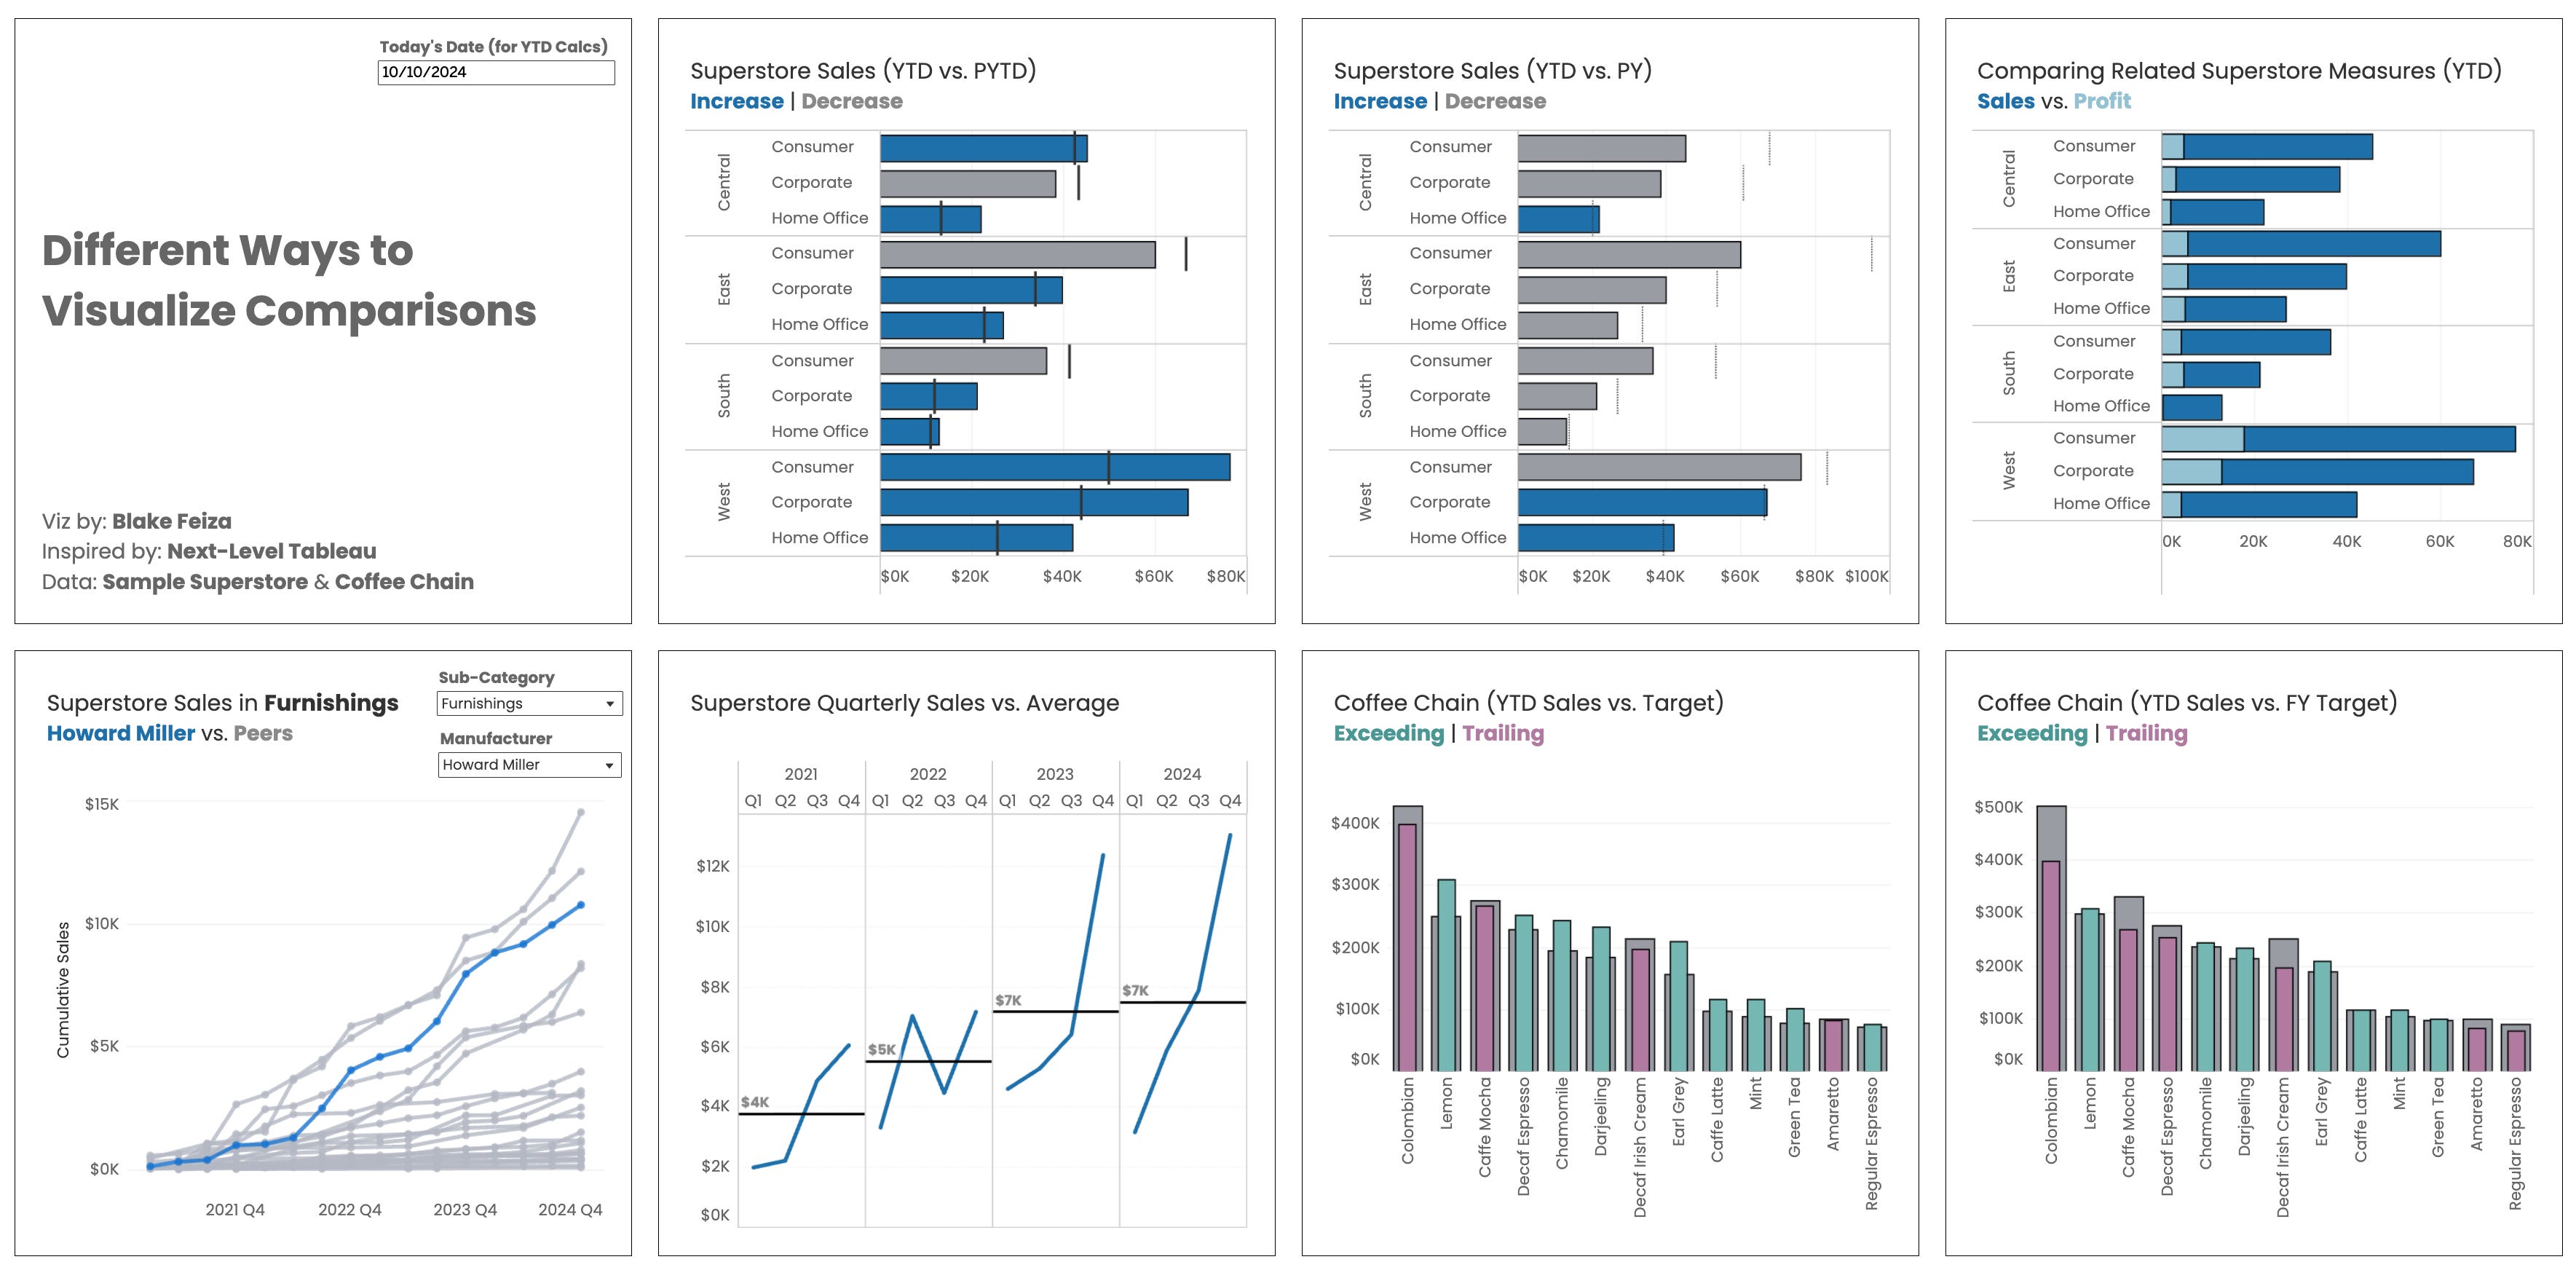
Different Ways to Visualize Comparisons | #NLT by Blake Feiza

Dashboard Picks
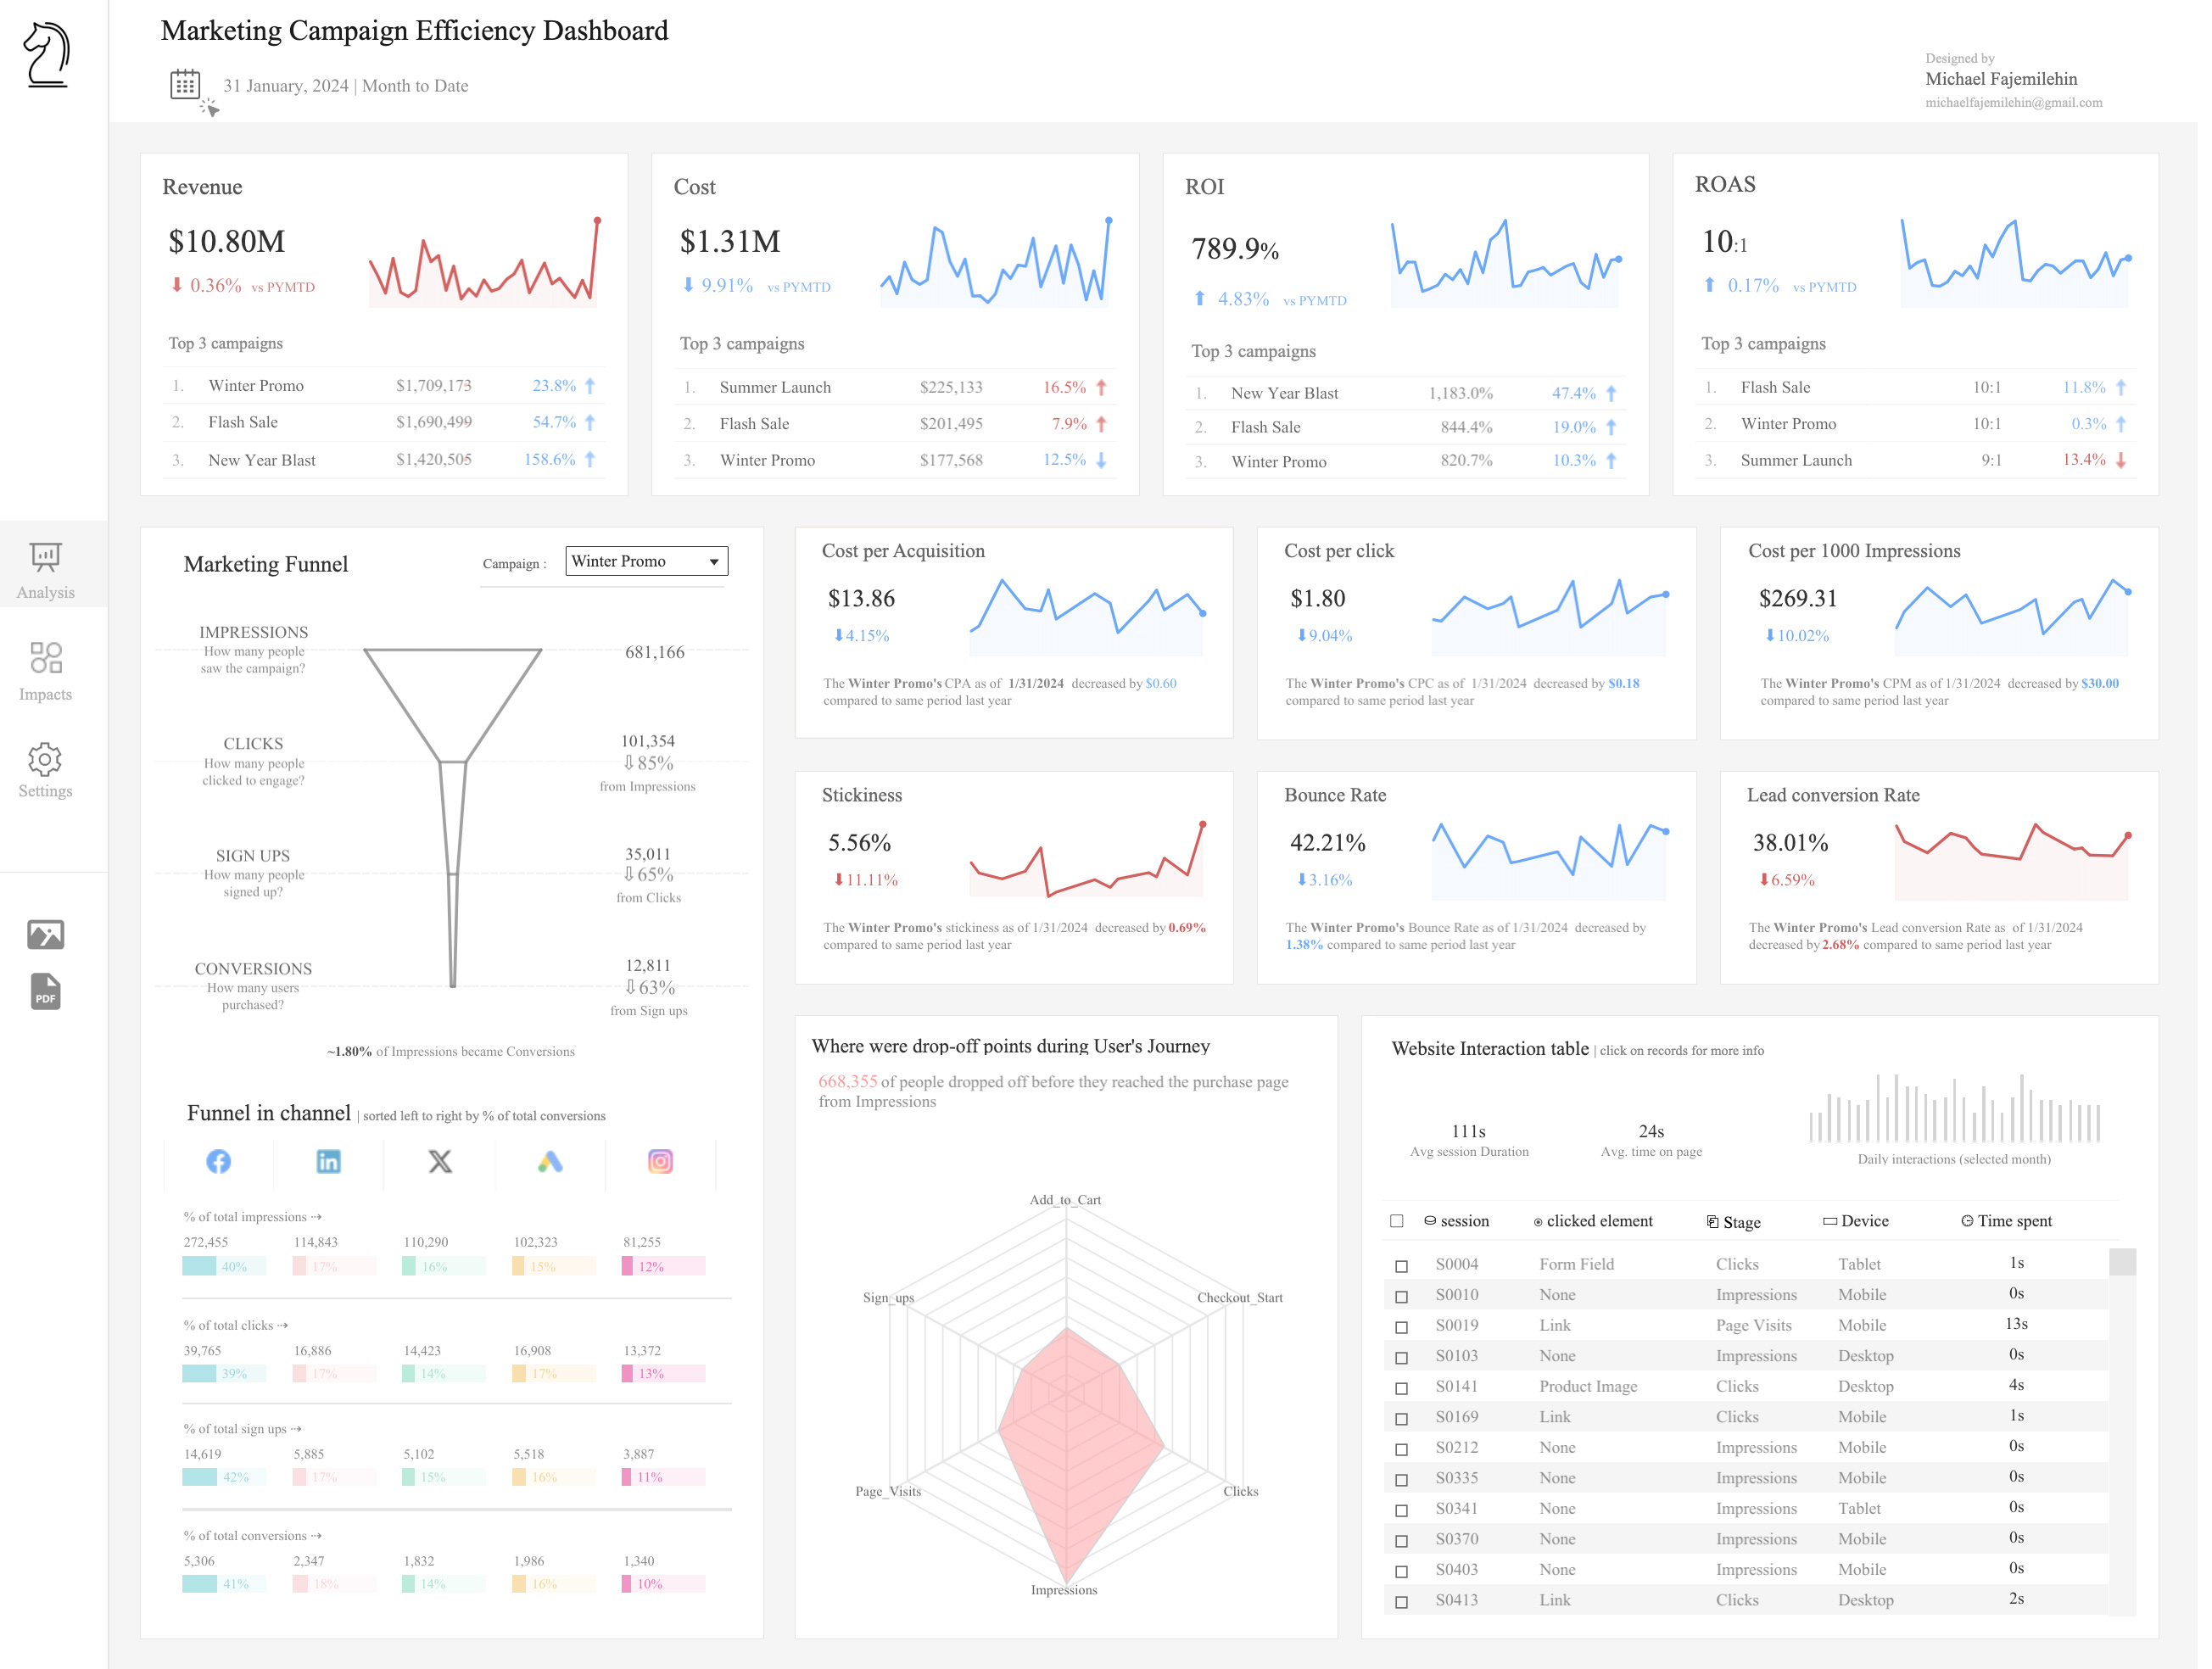
Marketing Campaign Efficiency Dashboard by Michael Fajemilehin

Sales Performance by Biokpo Amachree

Business Insight Analytics by Olusola Tijani

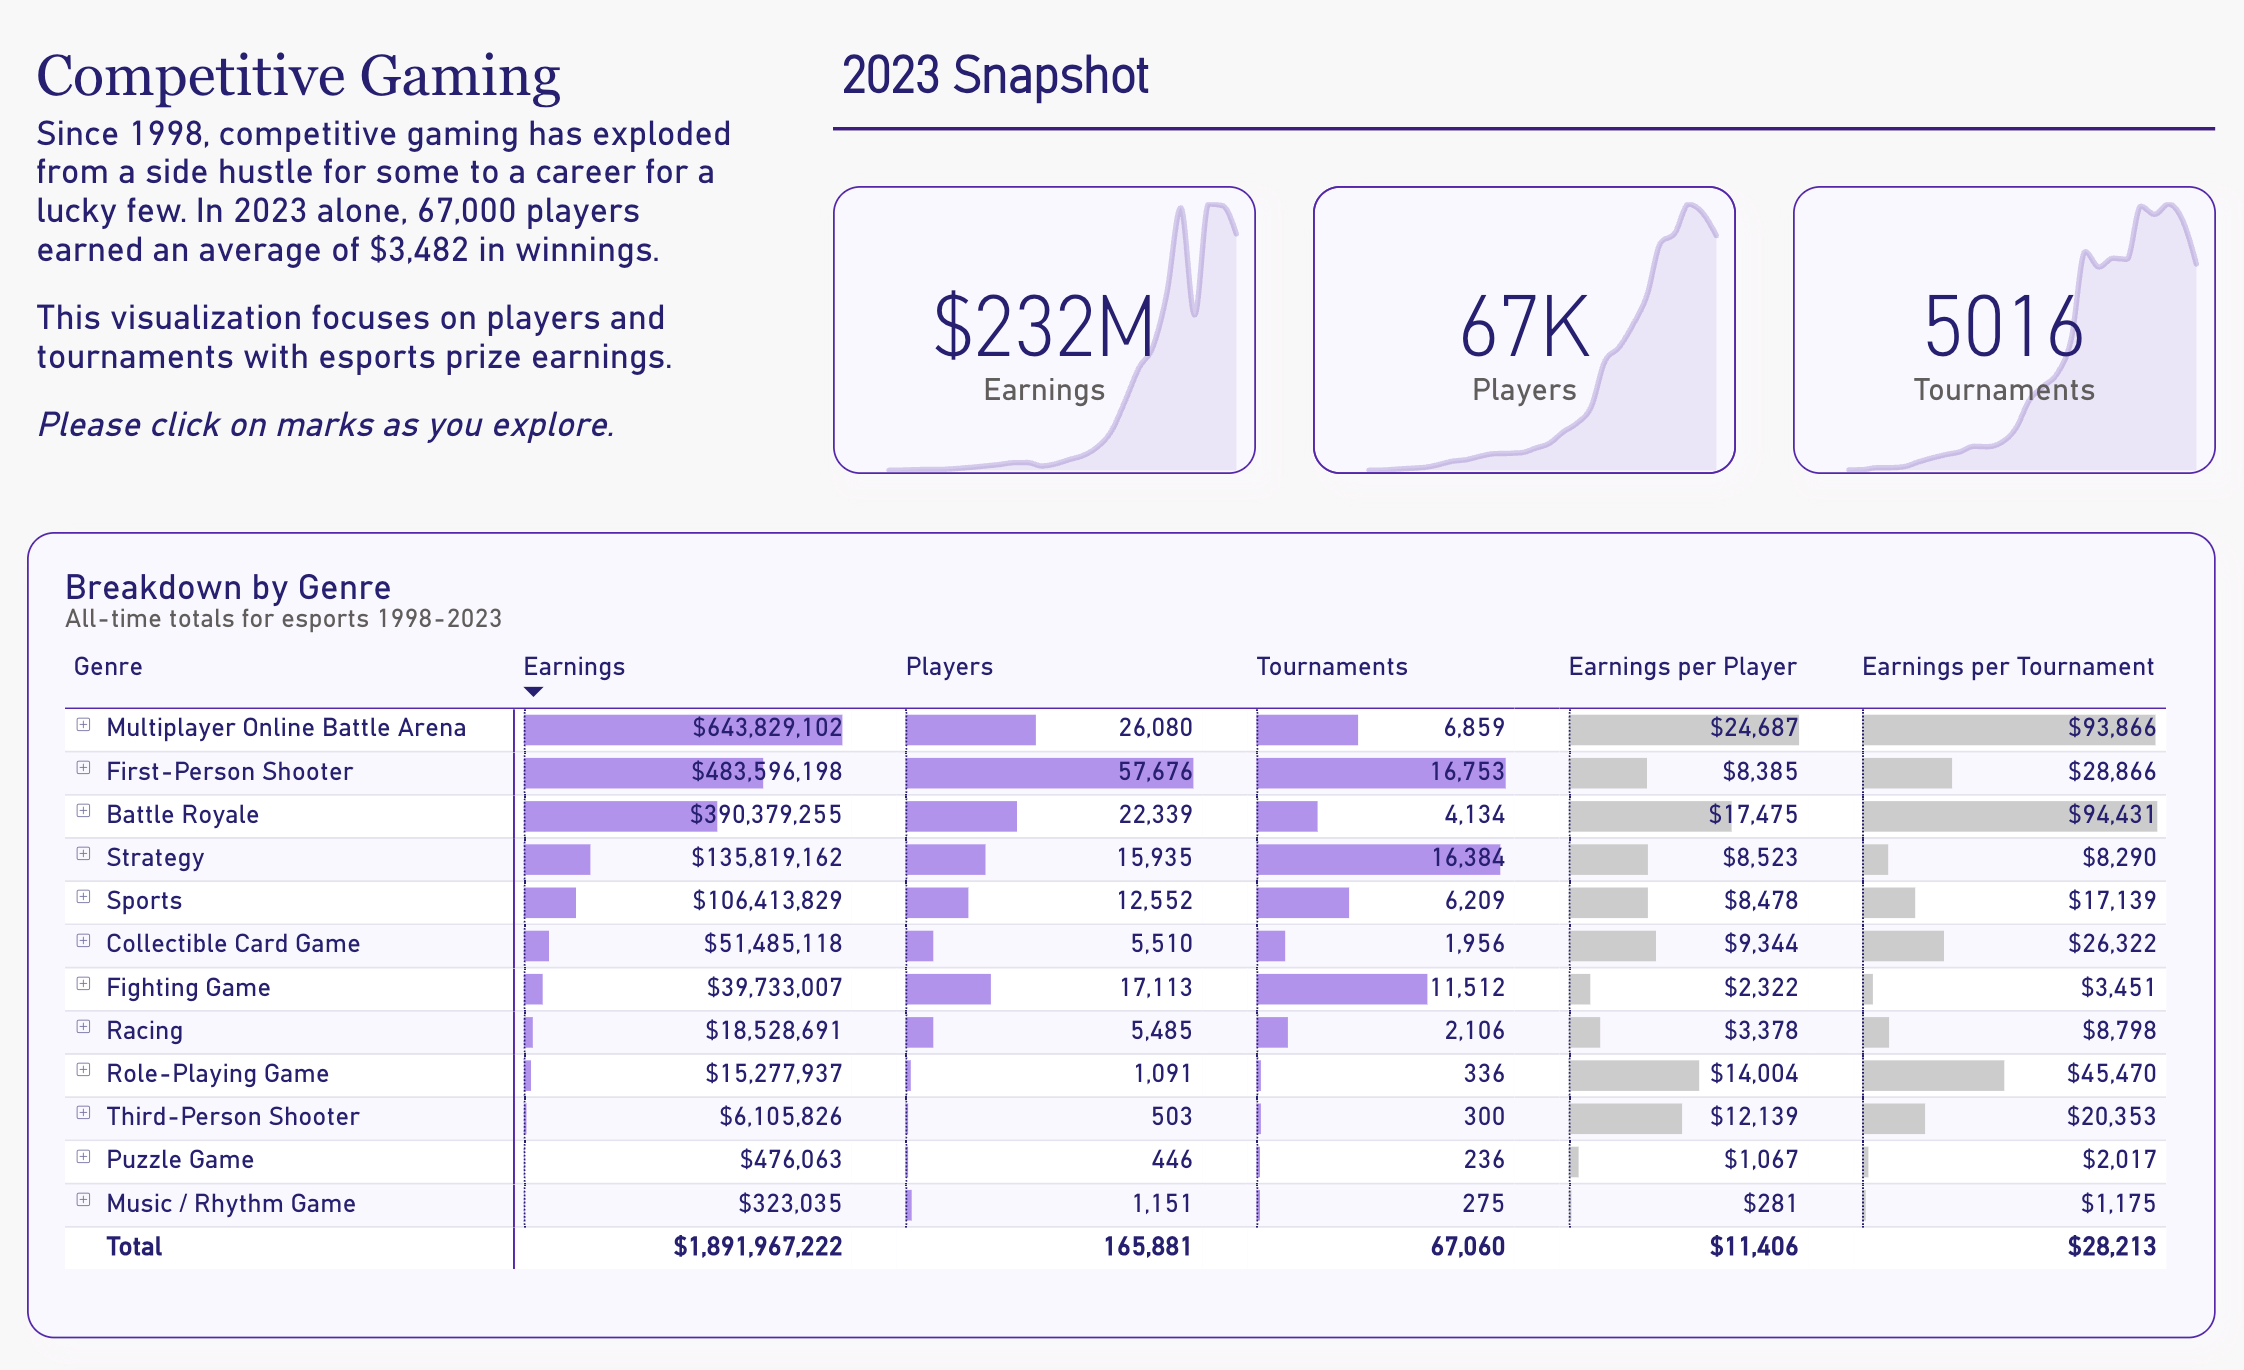
Esports Prize Earnings by Jane Kamata

Power BI Sales Dashboard by chukwunedum ossai