DataViz Lies, Crypto Dashboard and new Power BI features
🚀 last week news, educational materials and visualisations
Power BI & Tableau related
Educational and Useful
Advanced Techniques in Lying Using Data Visualizations. This article is satire! by Cai Parry-Jones
Racing Bar Charts: An Experiment in Interactive Storytelling by Catherine Ramsdell
List of data visualisation books written by women curated by David Johnston
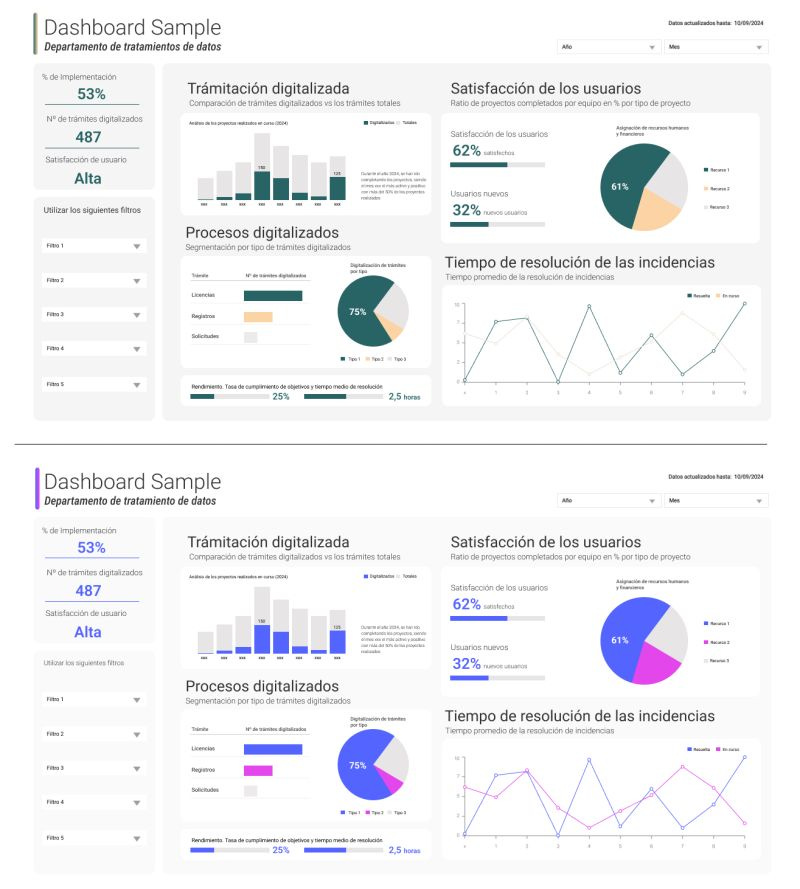
Why Prototyping Reports with Mock-ups Is a Game Changer by Ricardo Tranquilli Navarro
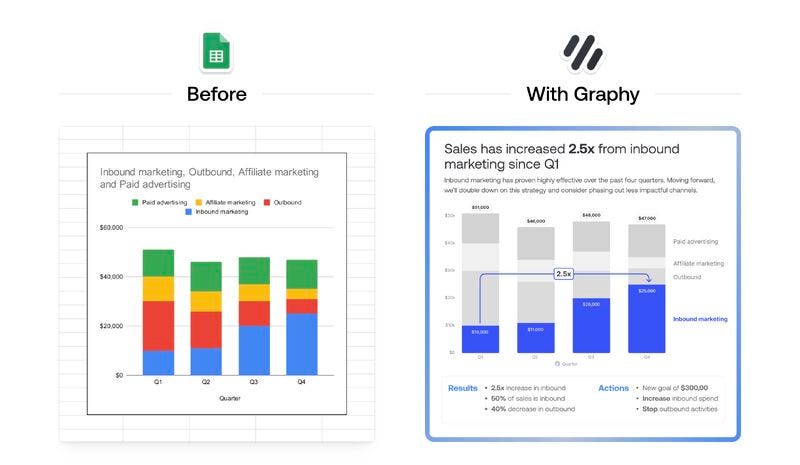
Adding Storytelling to charts with Graphy by Andrey Vinitsky


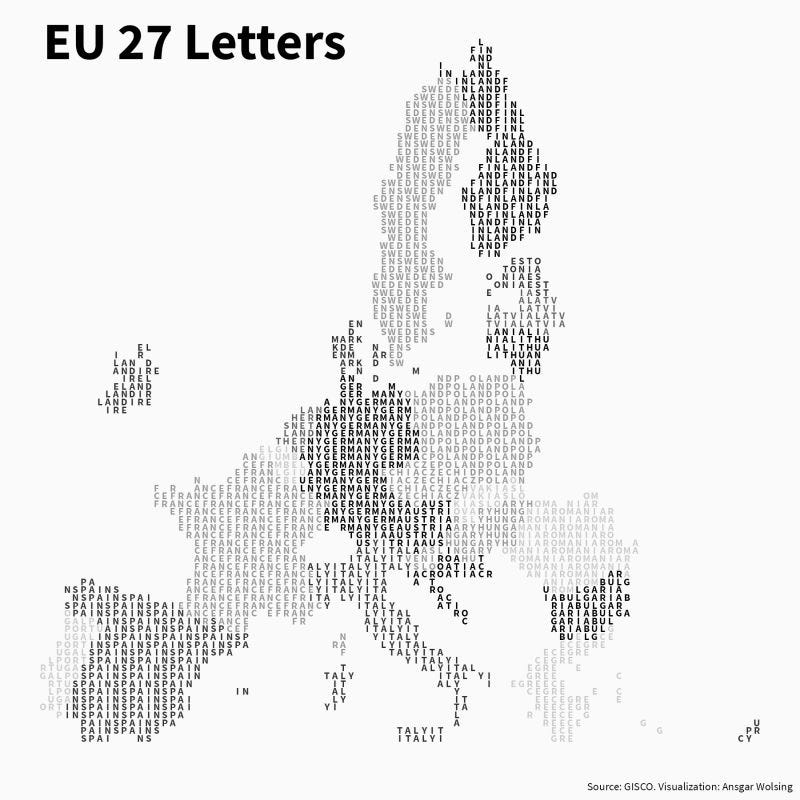
I really like that EU using letters map! Very cool!
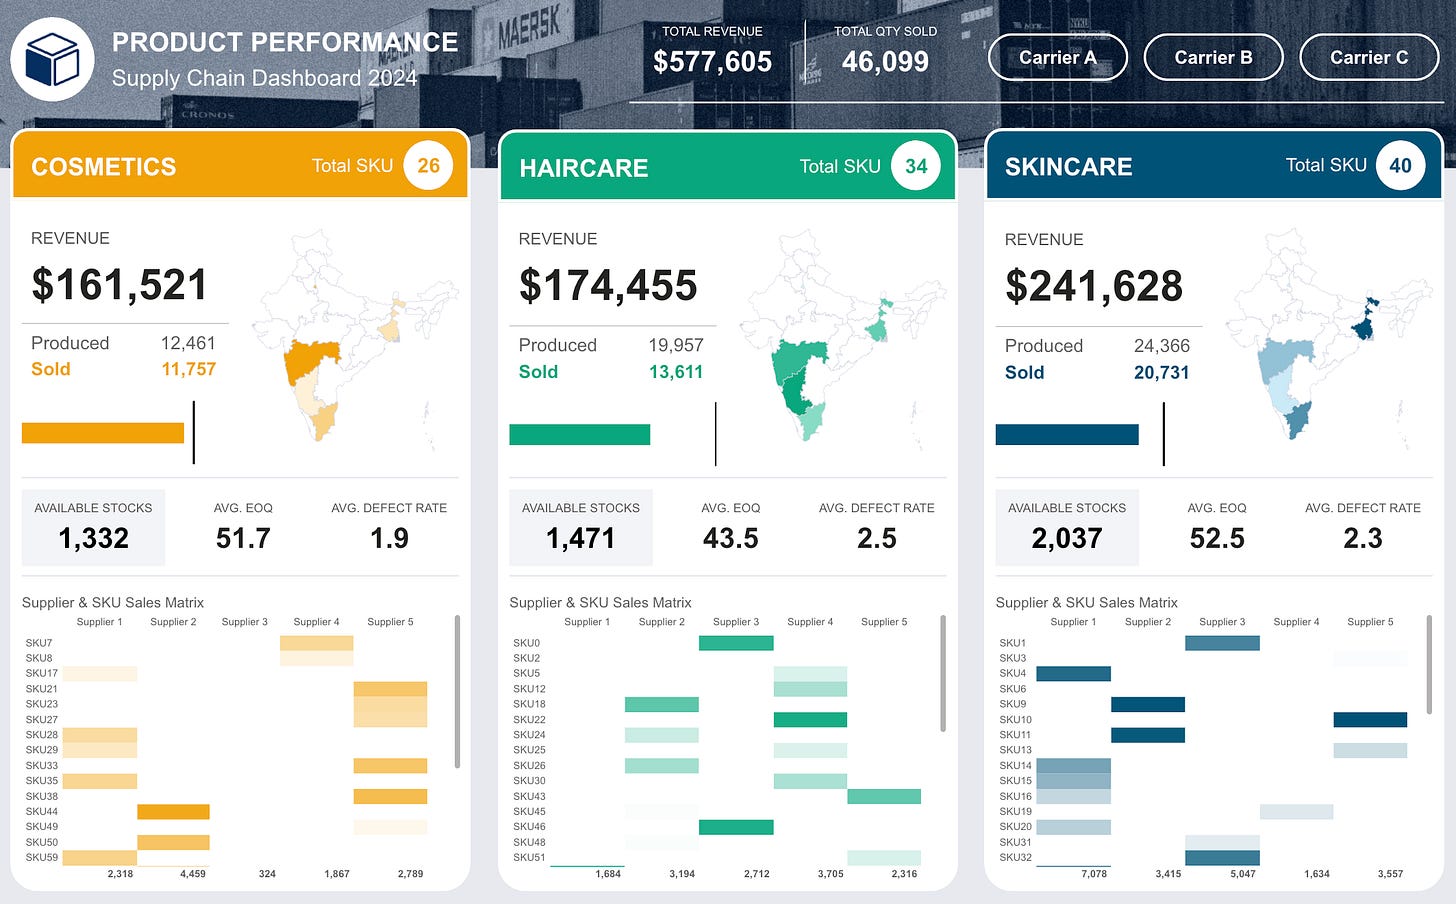
Interesting! 😍😍😍