30DaysChartChallenge, FemTech Dashboard and Gentrification
🚀 last week's useful matierials, dashboards and beautiful visuals

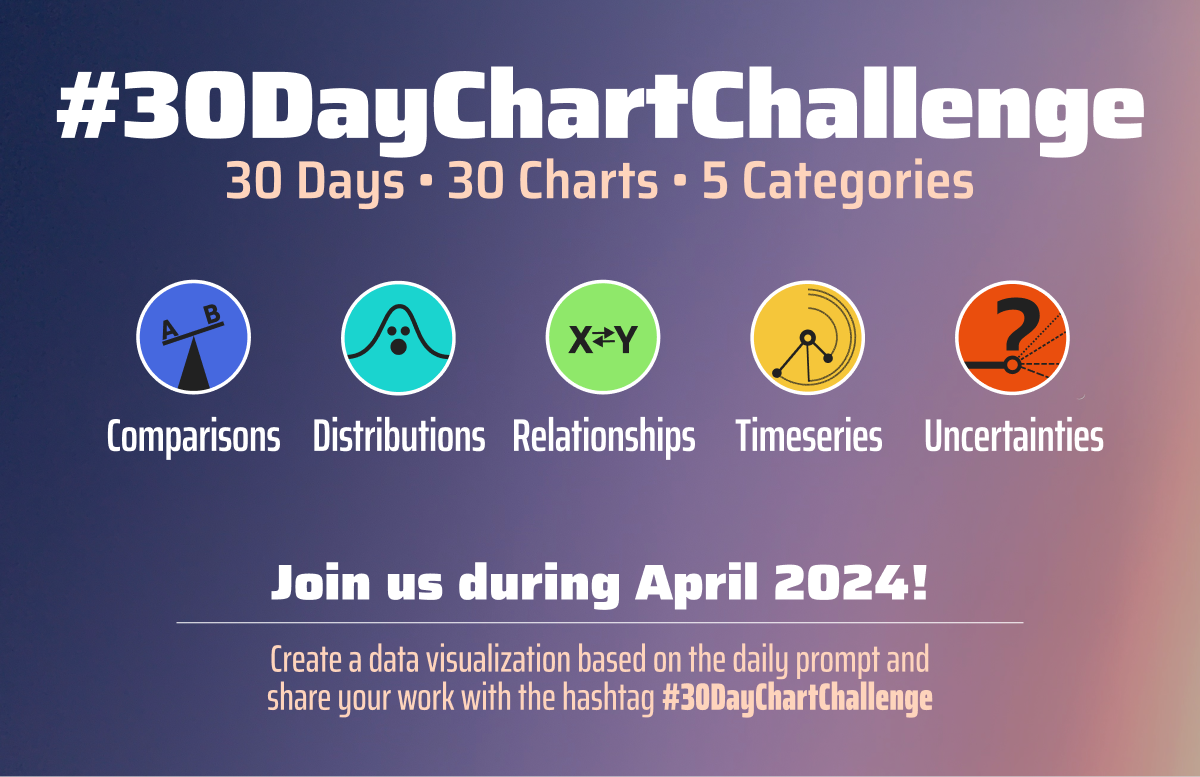
#30DayChartChallenge in April 2024
Data
How to choose the best business location using Open Urban Data & AI by Alexander Kamenev
ligafooty – A Python package for football tracking visualization and analytics.
morethemes: more themes for matplotlib by Joseph Barbier
Educational and Useful
Tutorial: How to create voxel-styled maps like this one by Marco Hernandez
Tableau Map Layers Magic: Heatmap + Marginal Histograms by Blake Feiza
Dashboard Picks
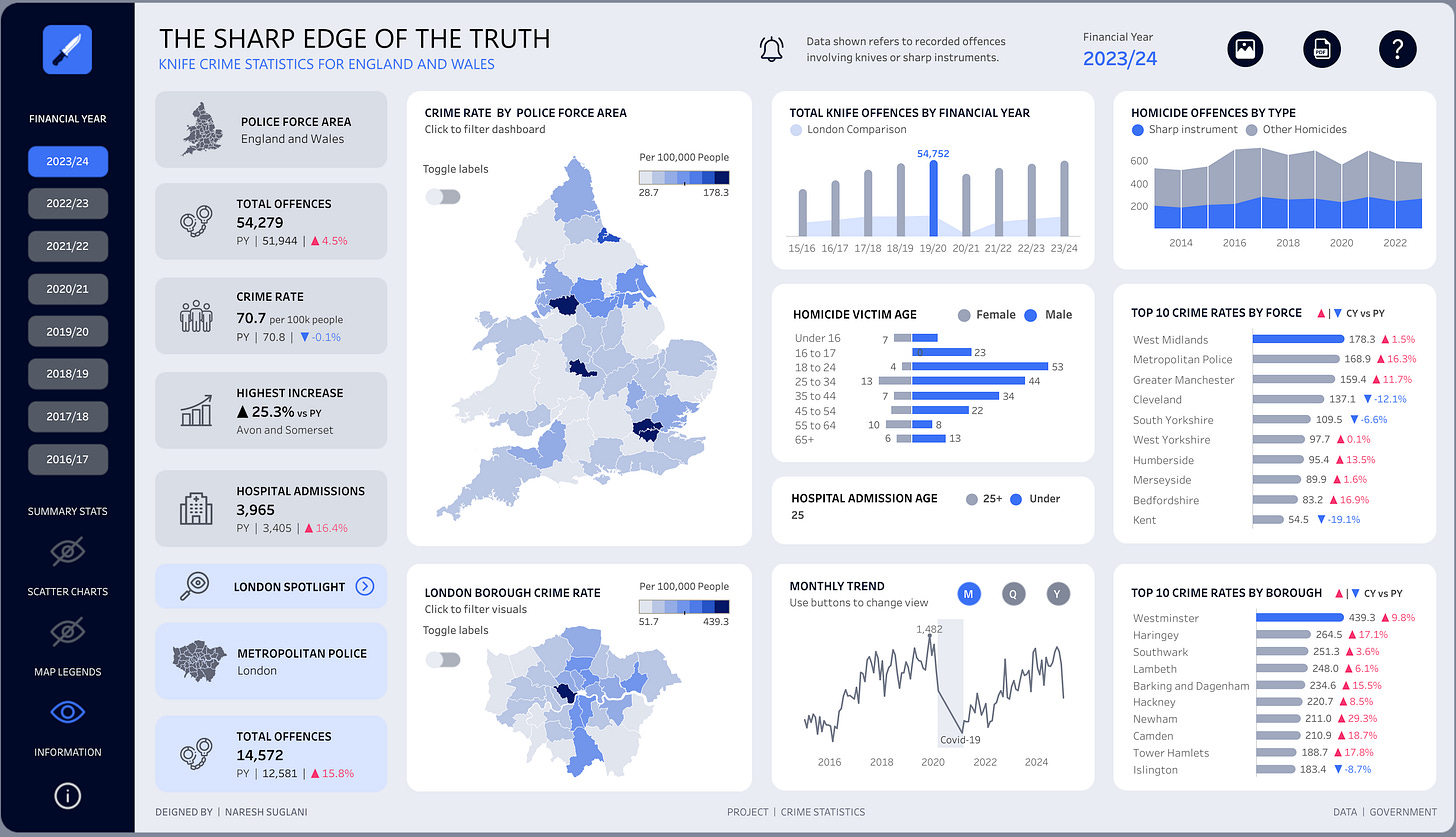
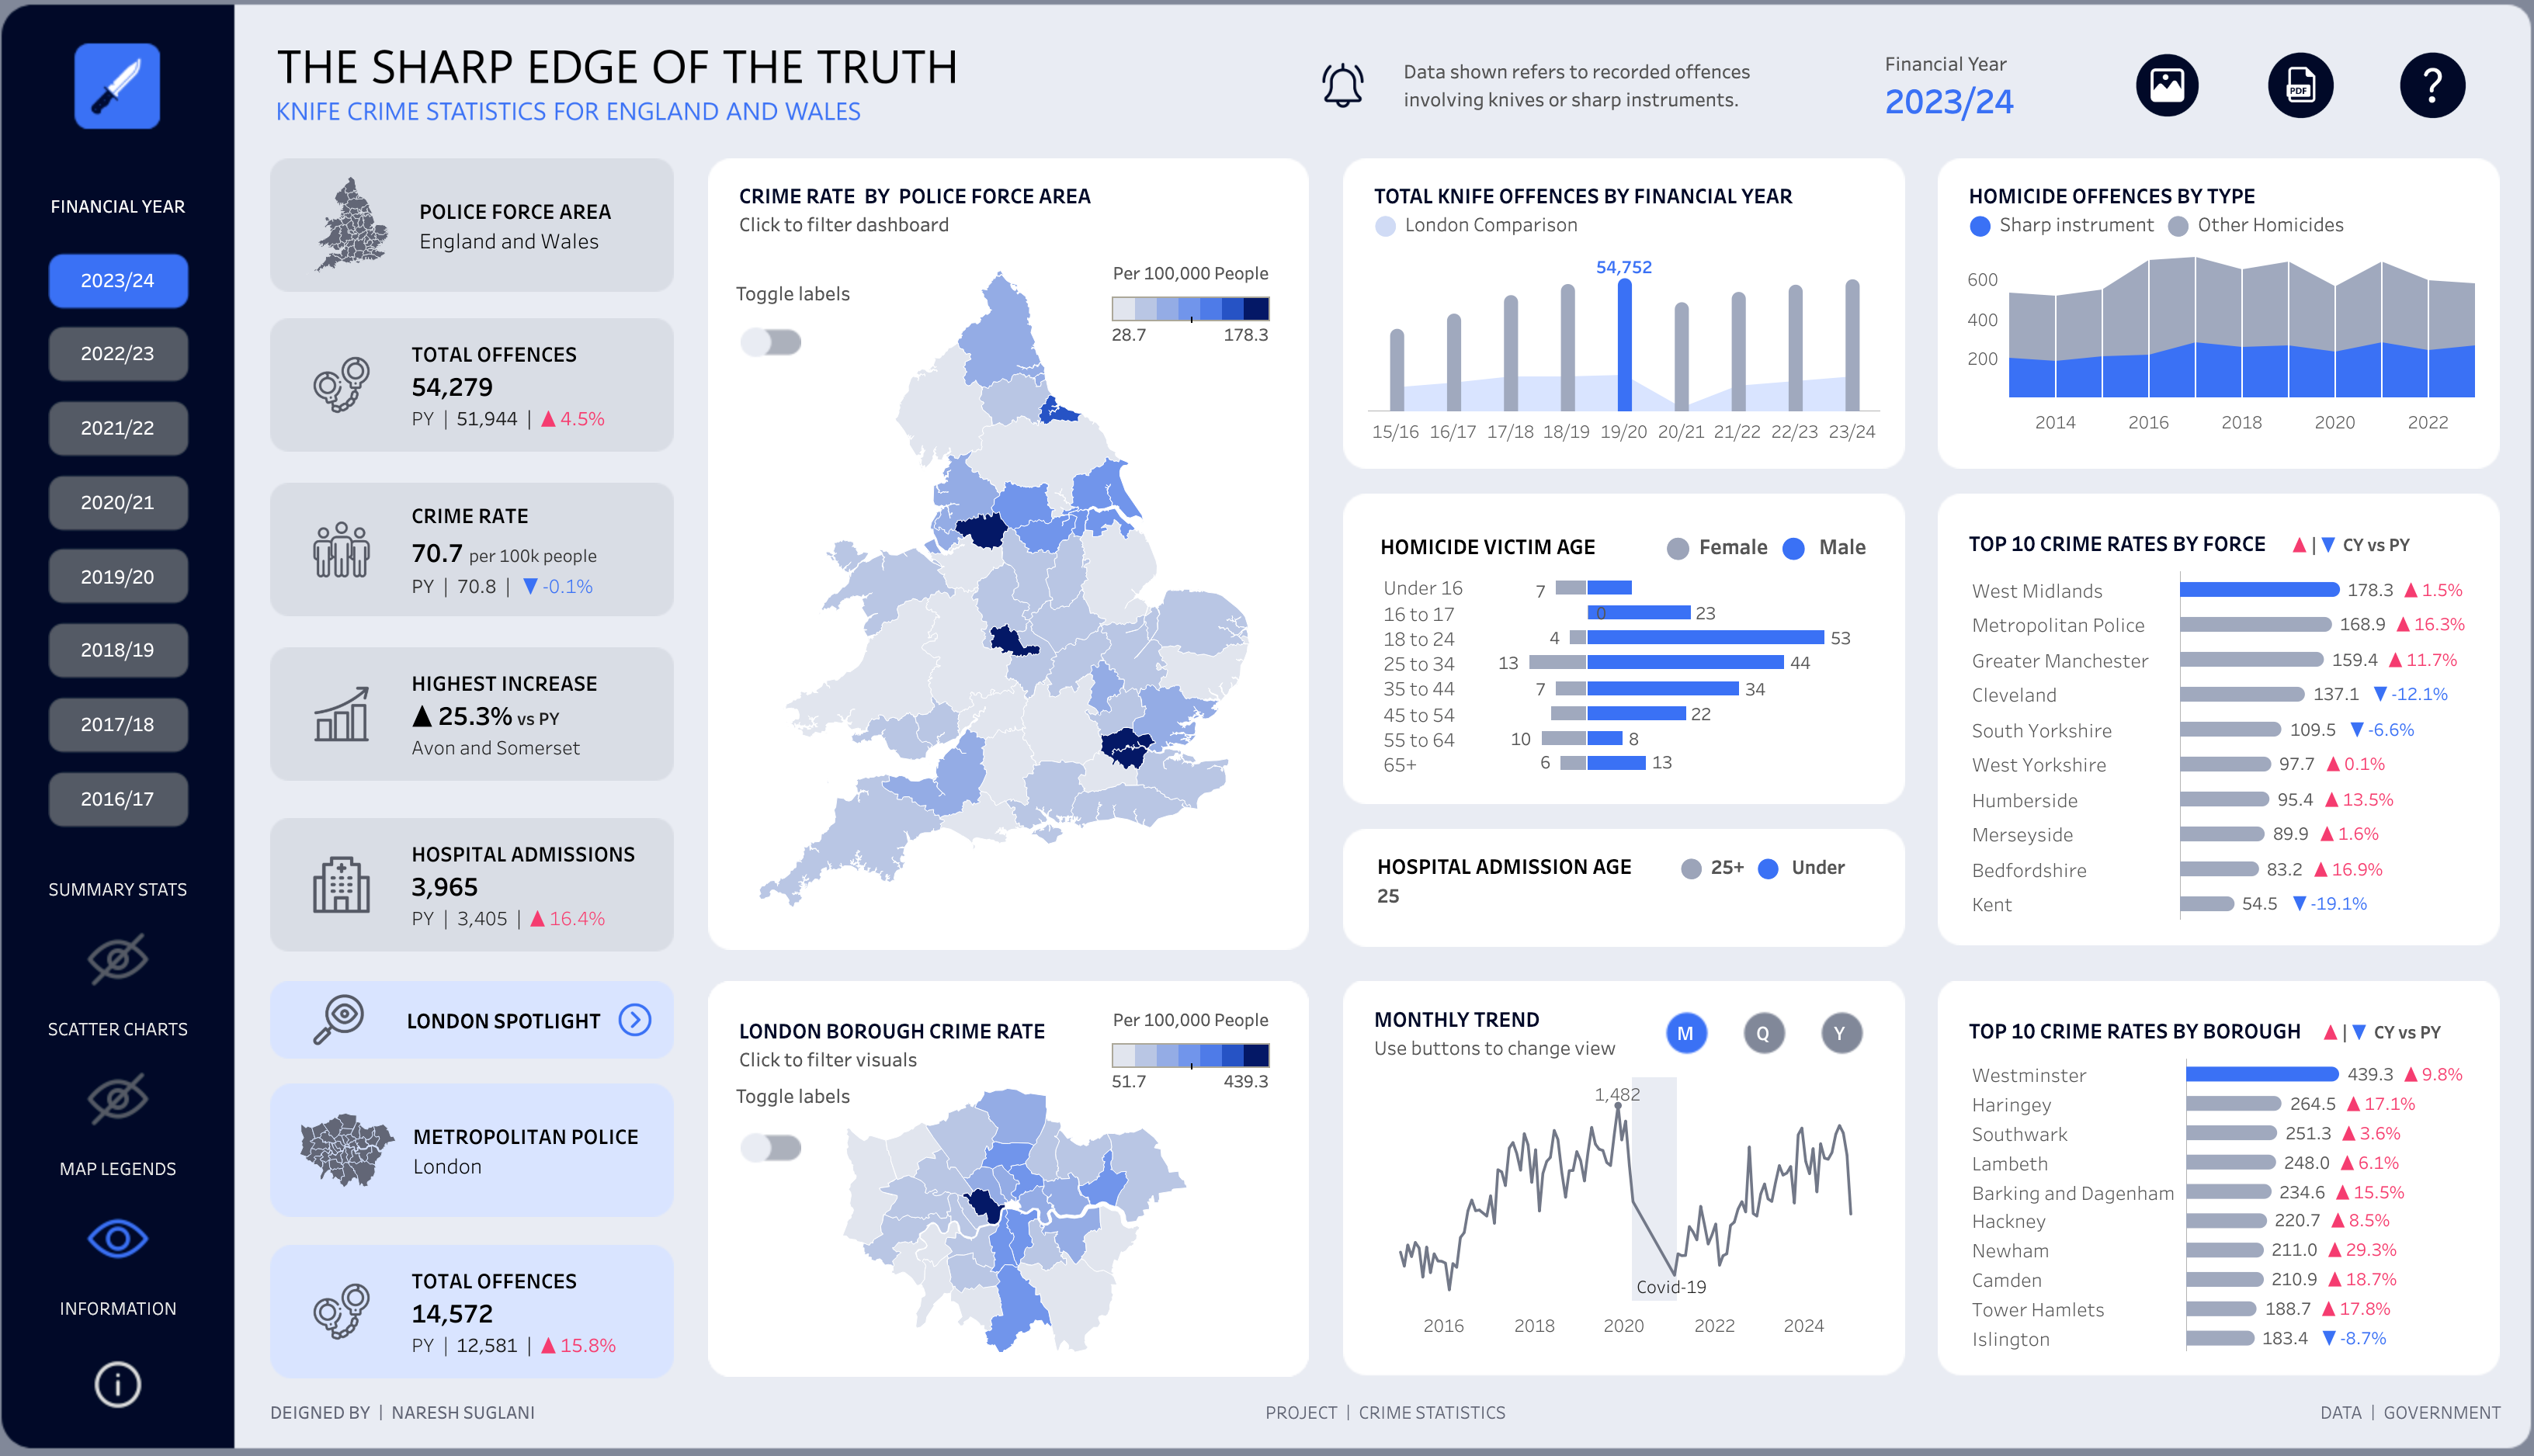
Knife Crime in England and Wales - The Sharp Edge Of The Truth by Naresh Suglani
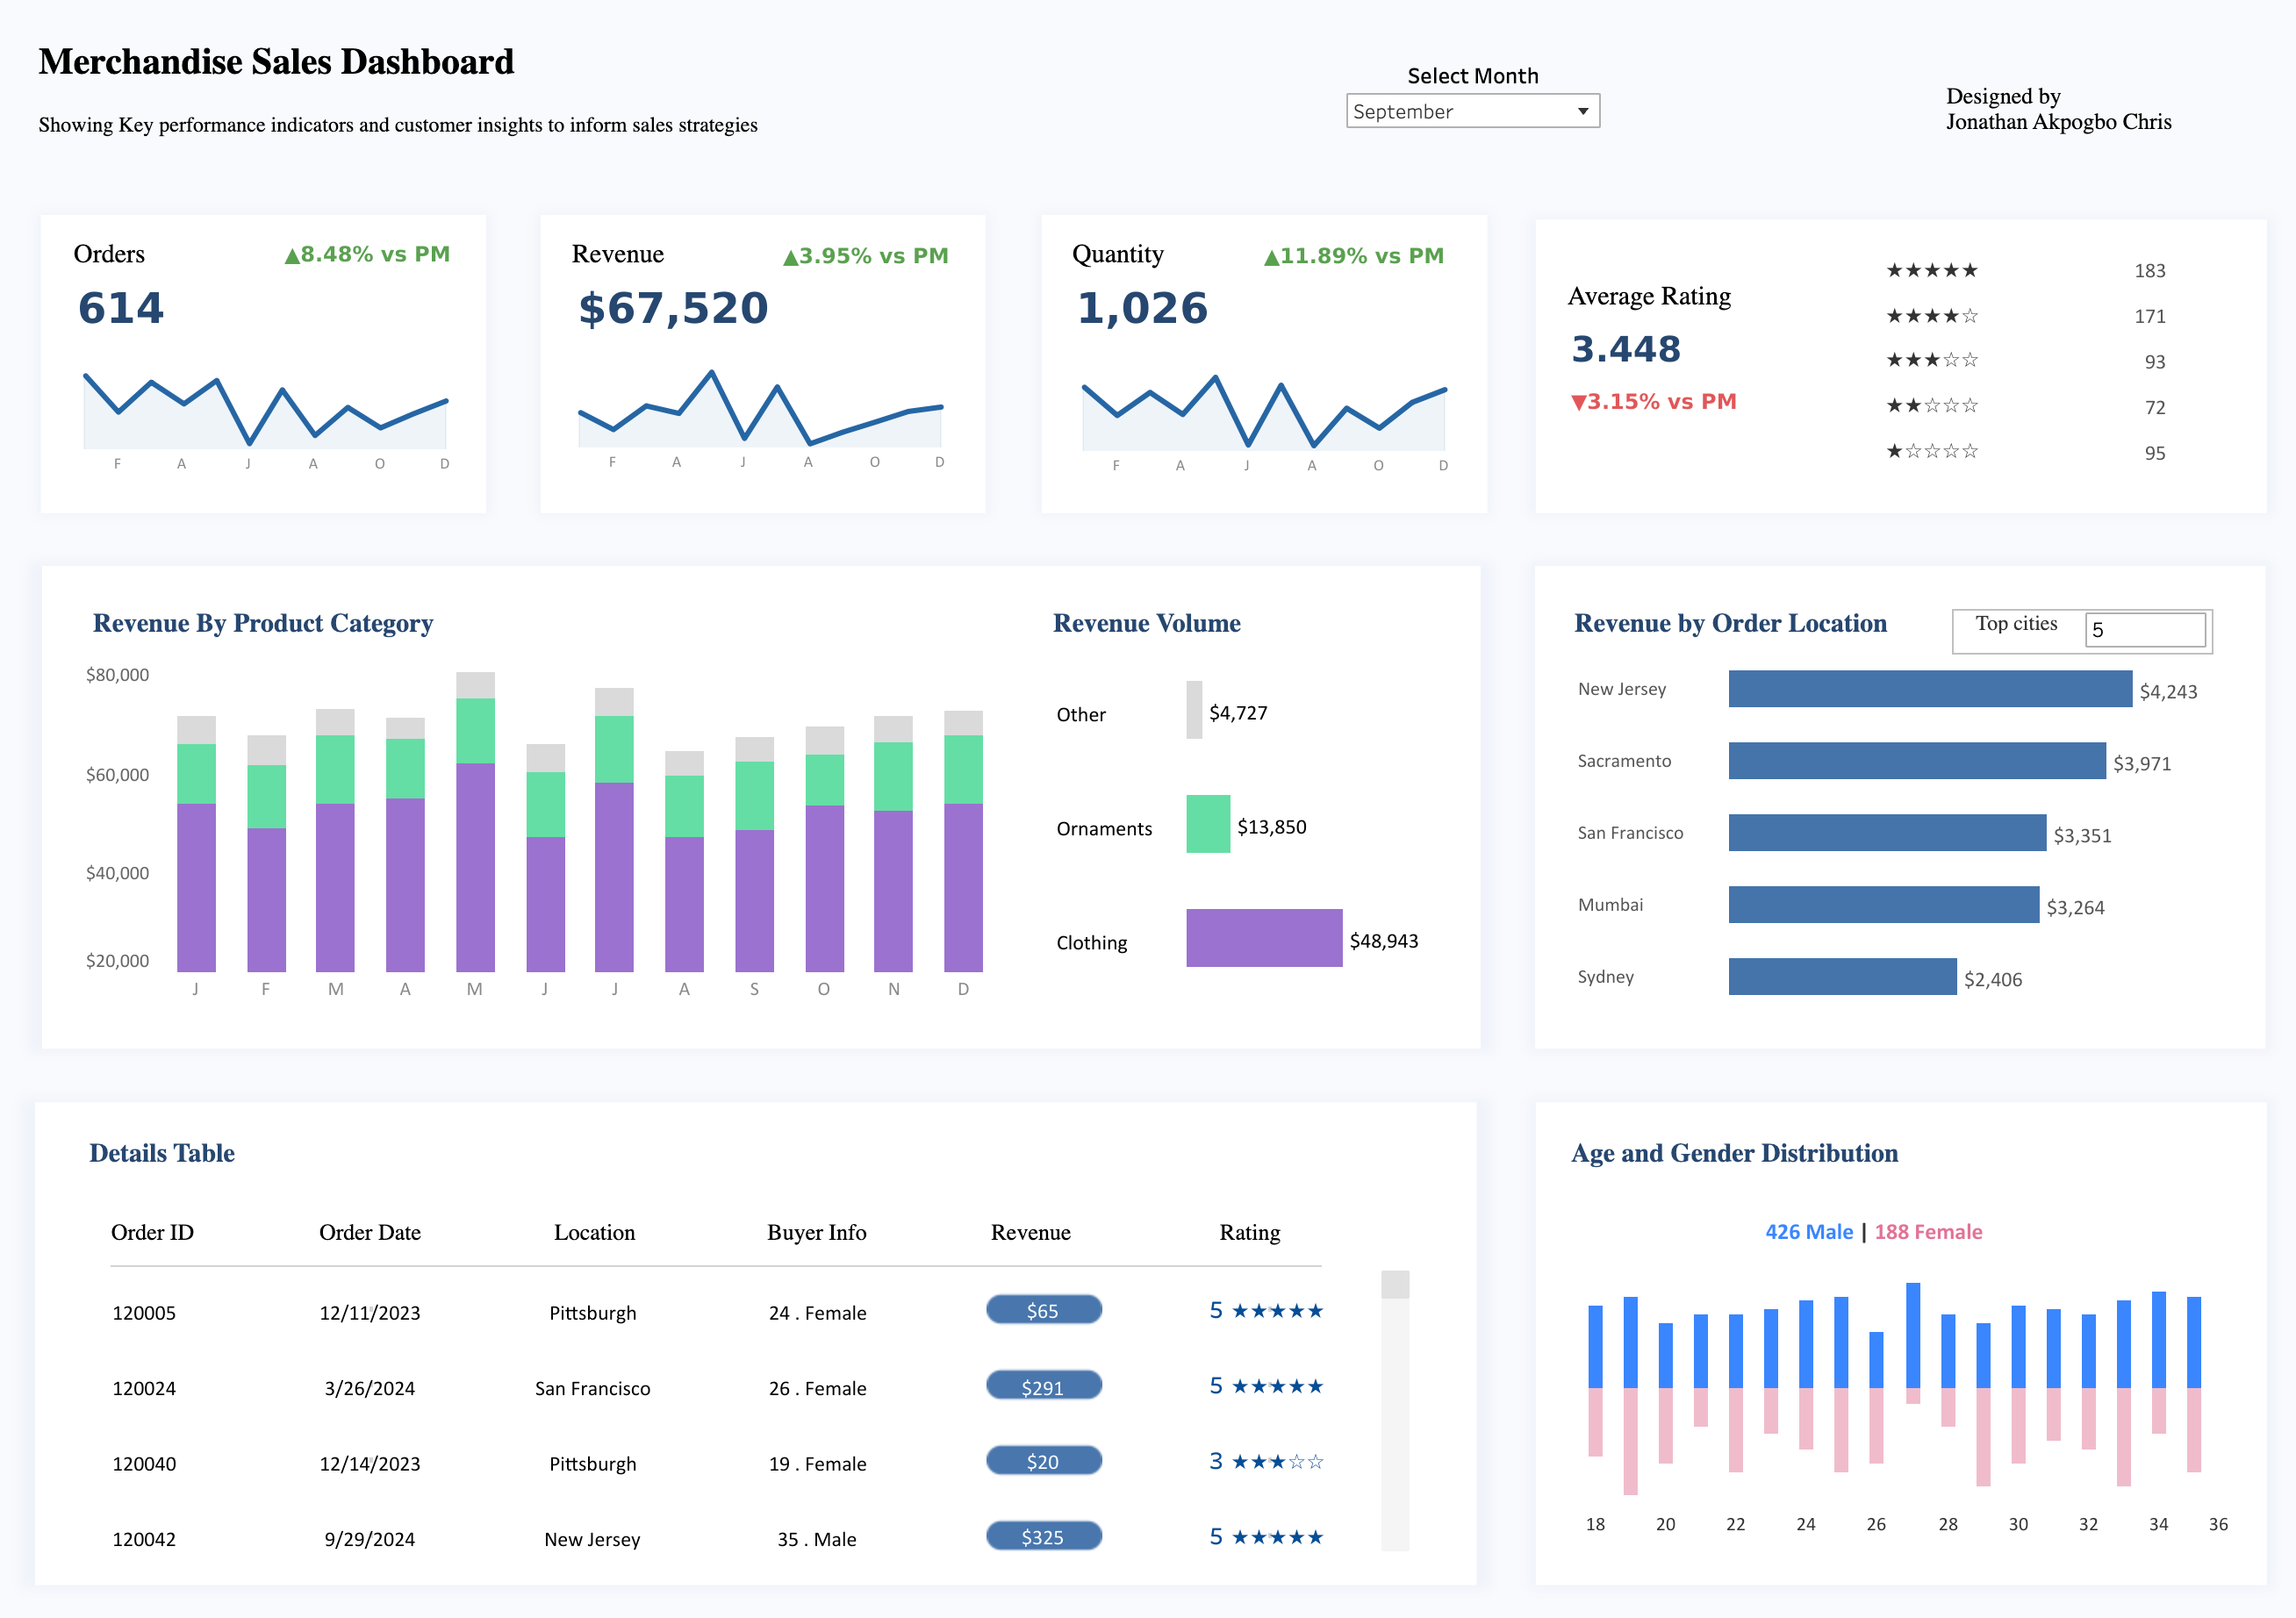
Merchandise sales dashboard by Jonathan Akpogbo Chris

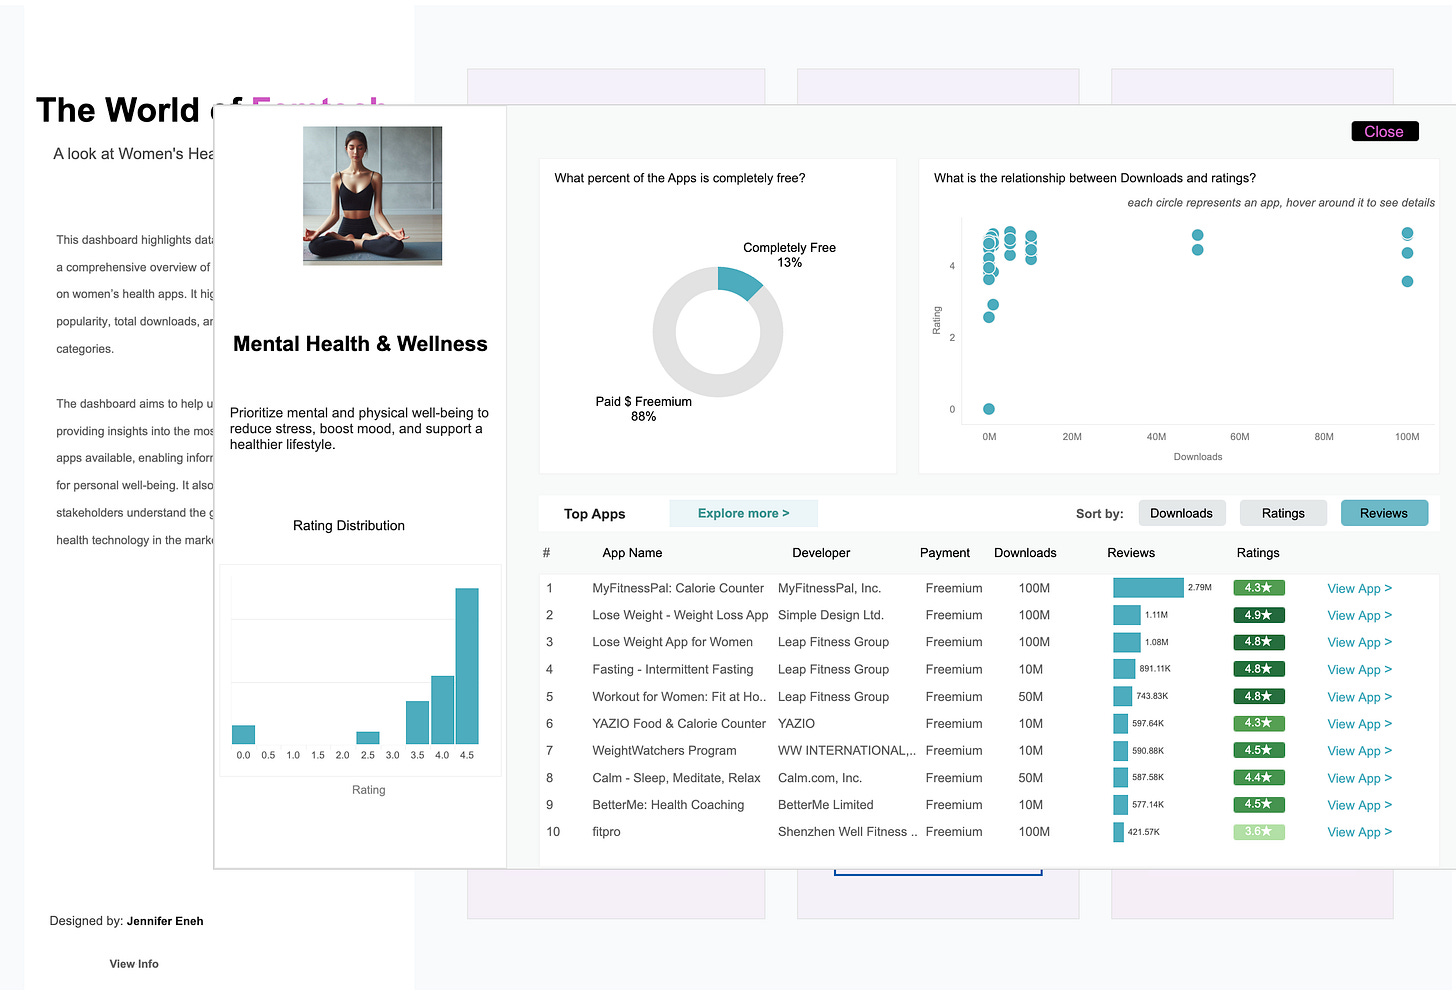
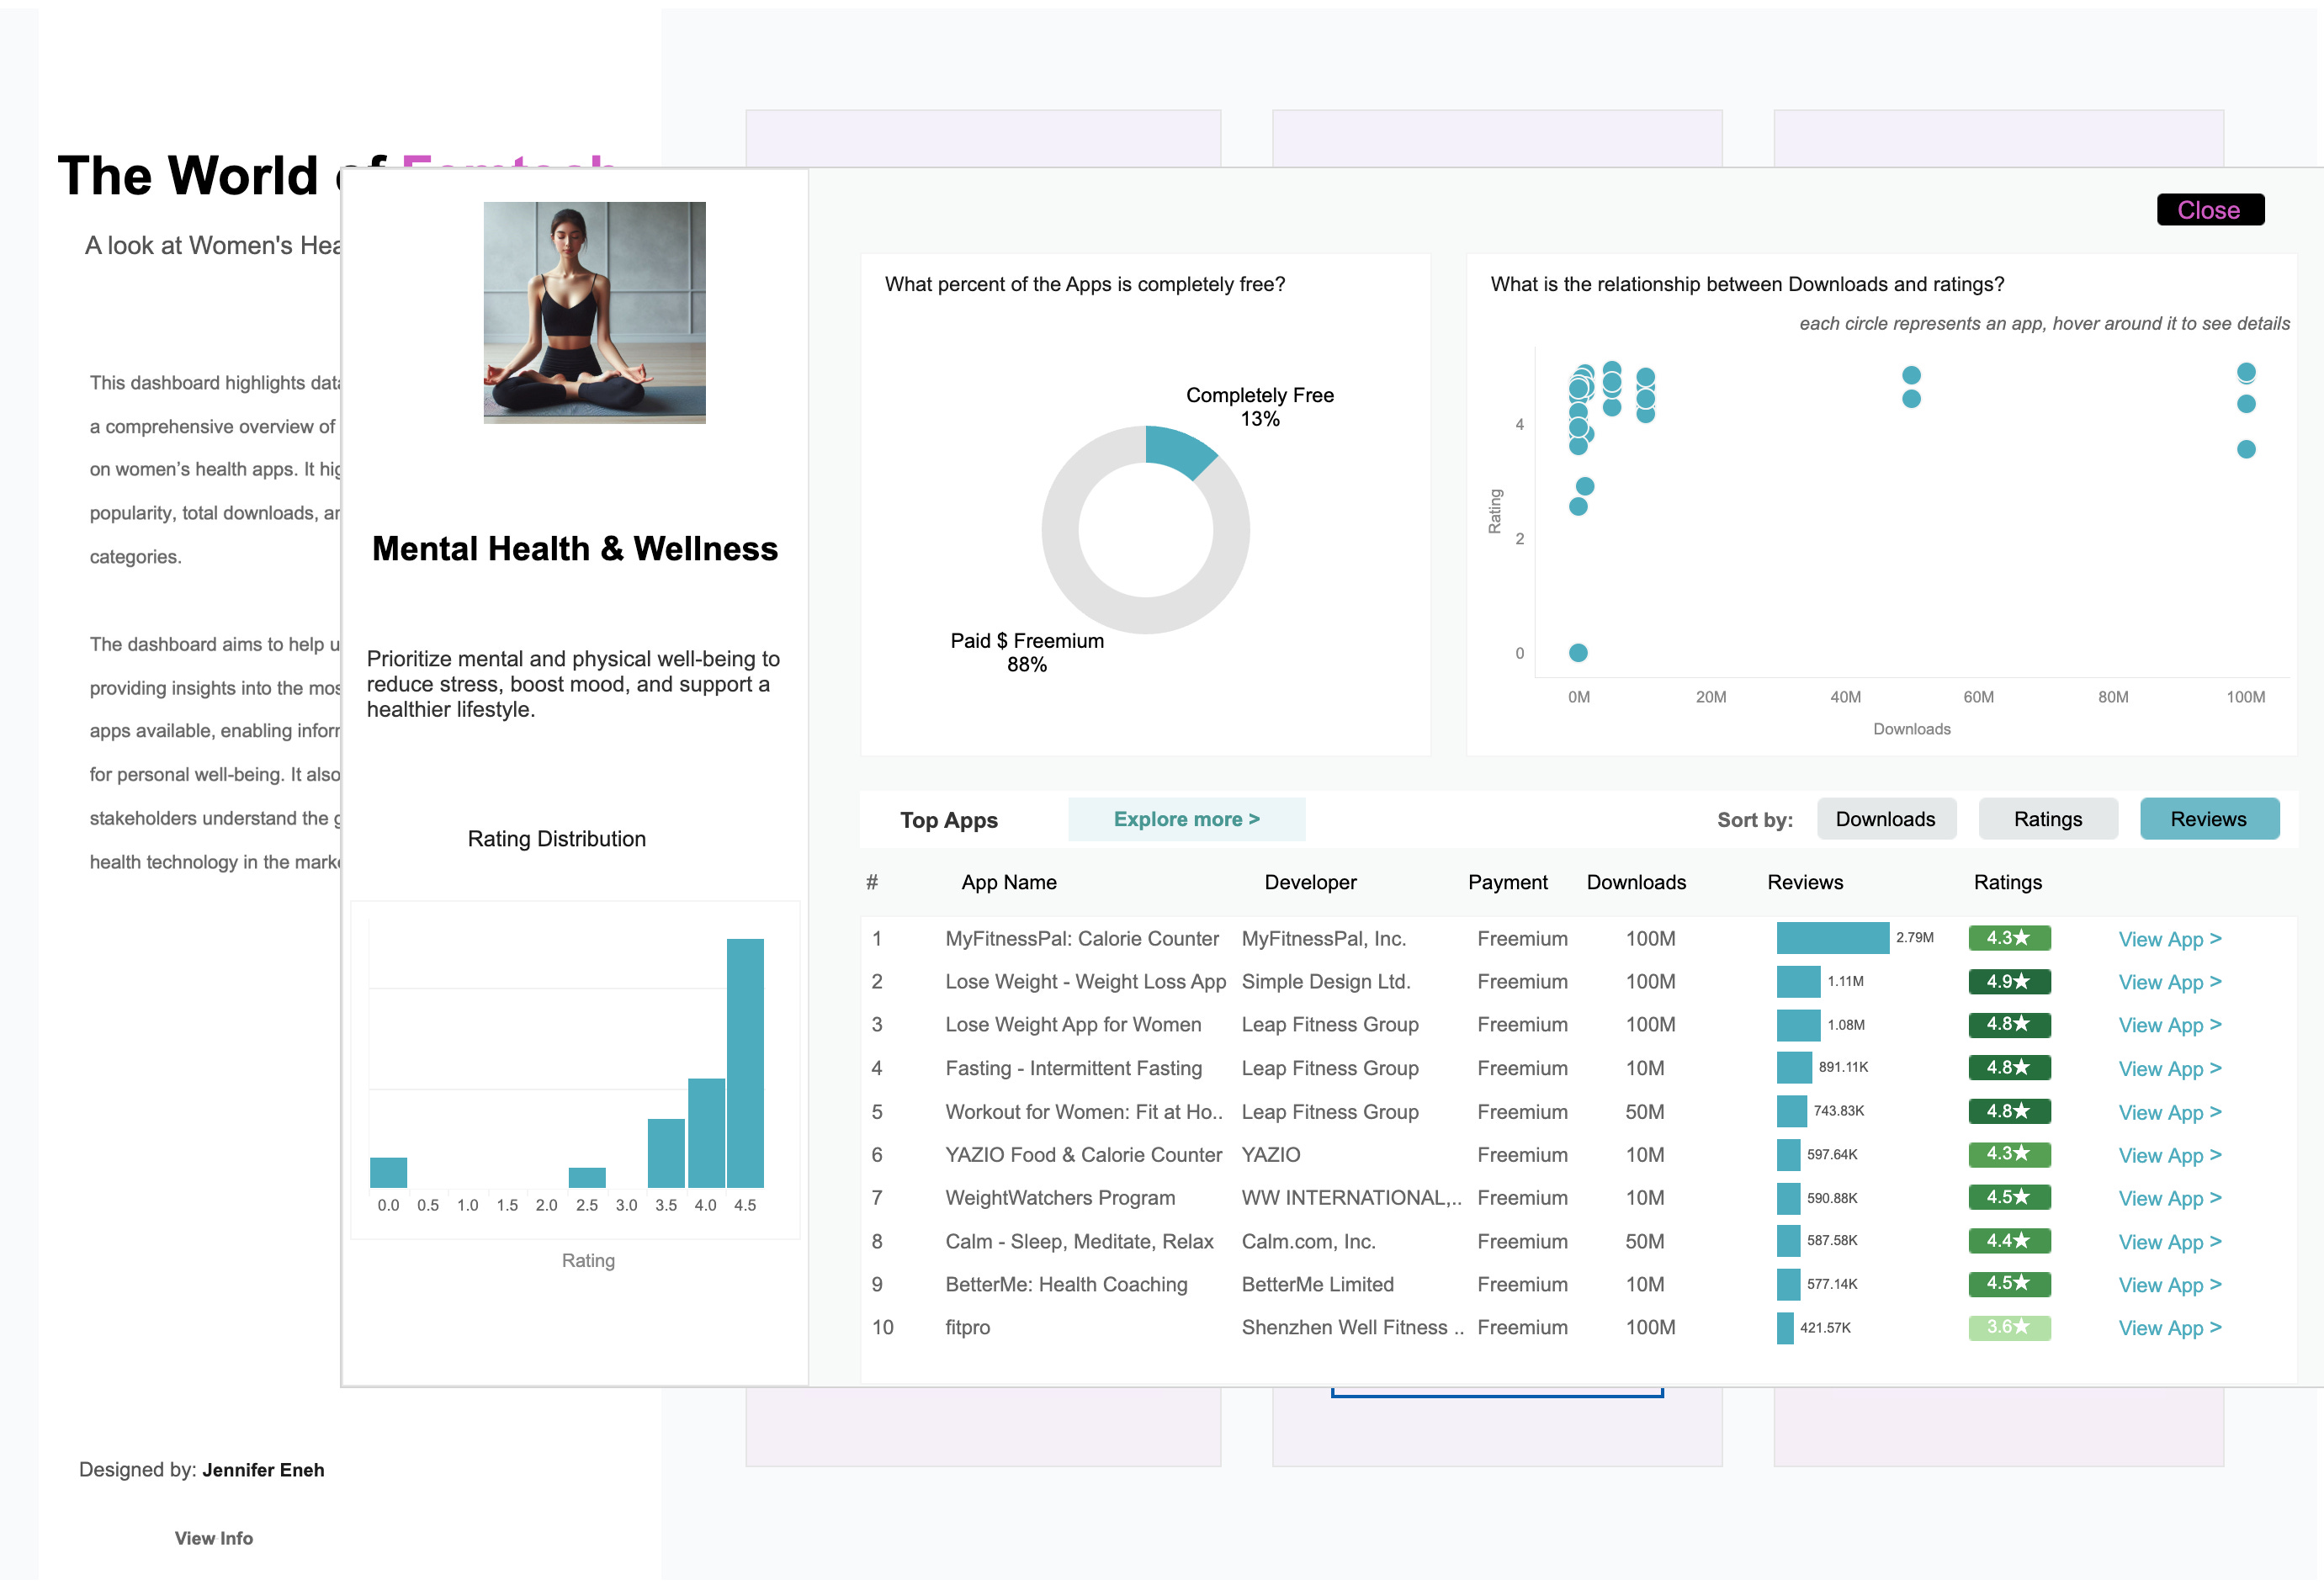
Femtech dashboard | Women's health apps by Jennifer Eneh
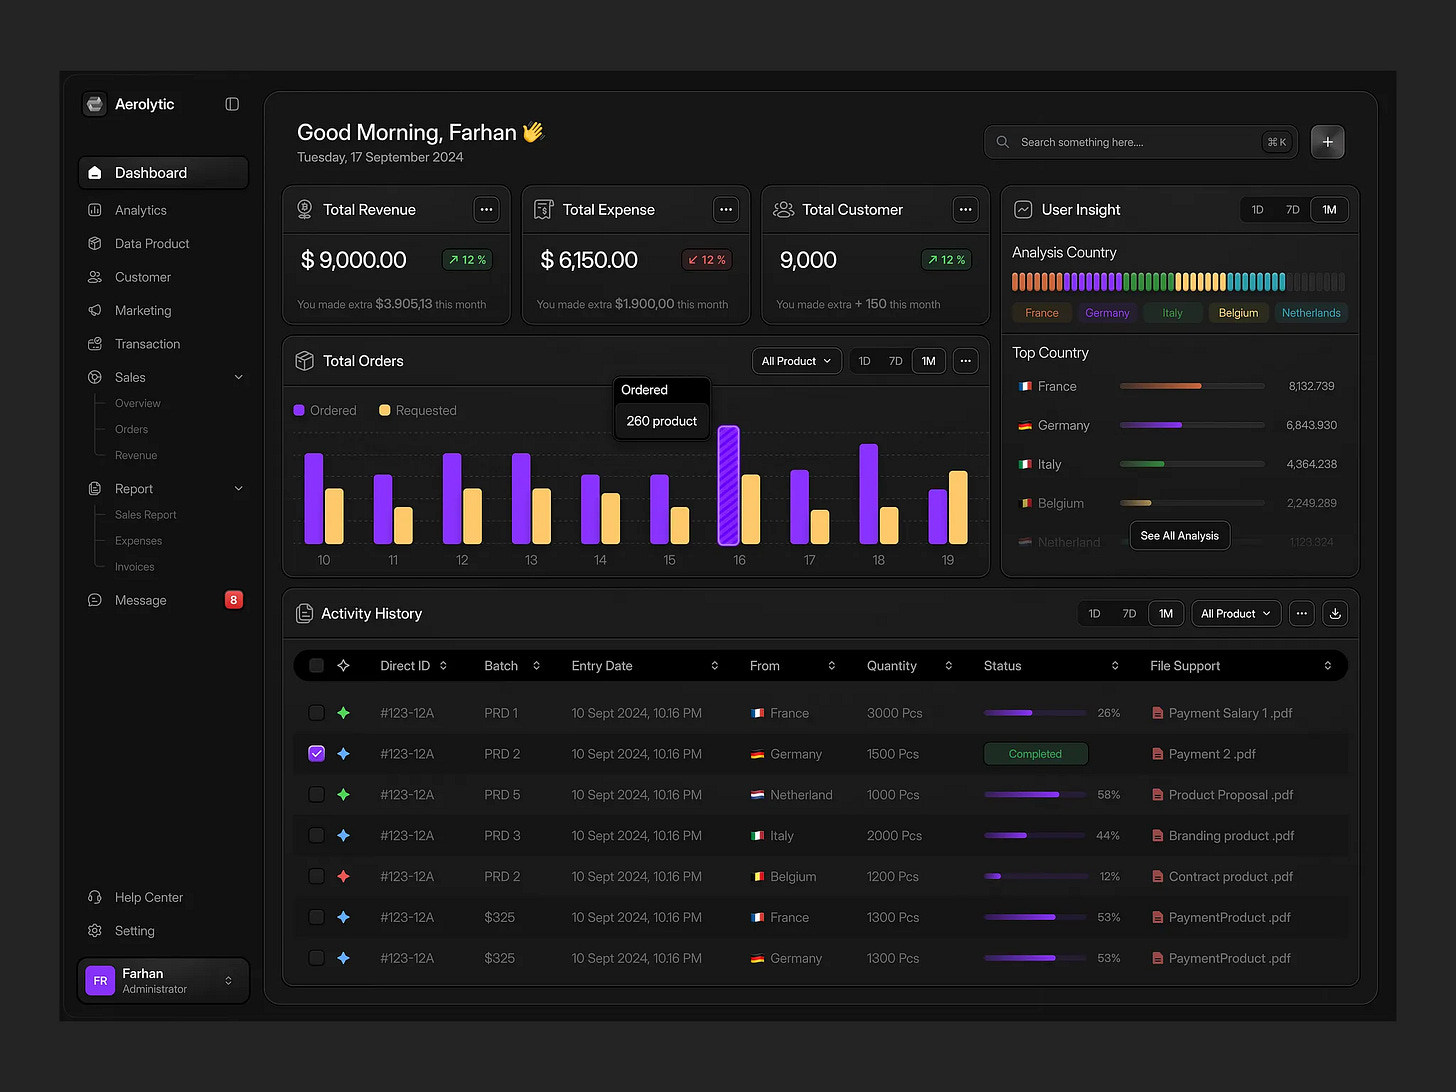
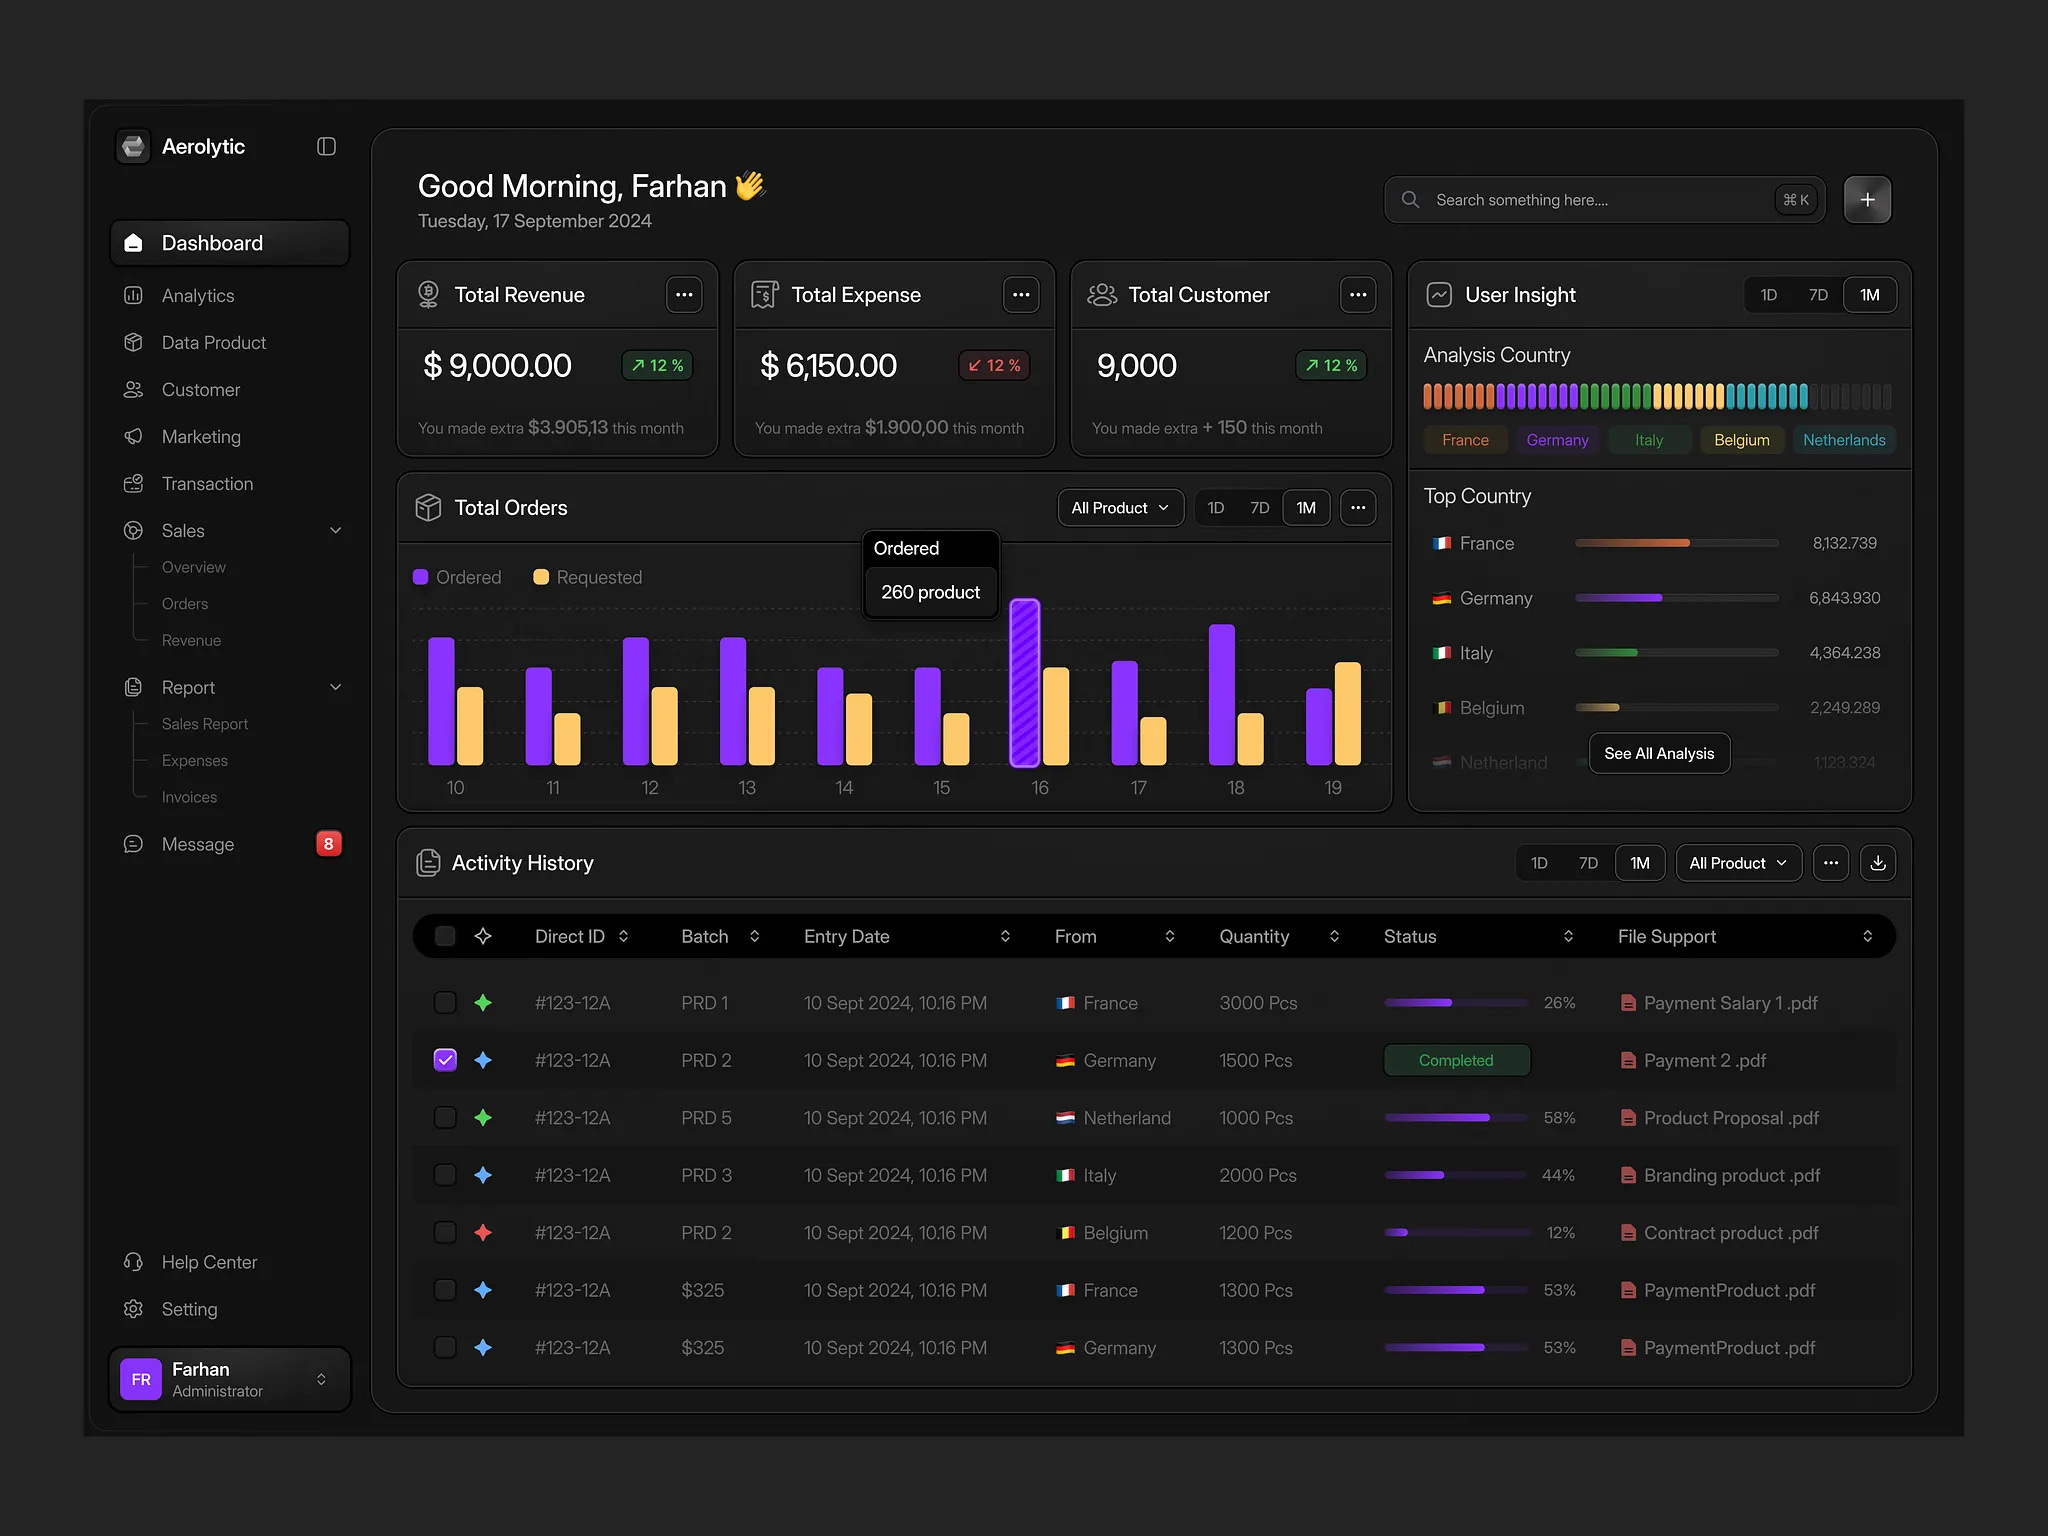
Aerolytic - Sales Analytics Dashboard by Muhammad Farhanudin
Visualization Picks
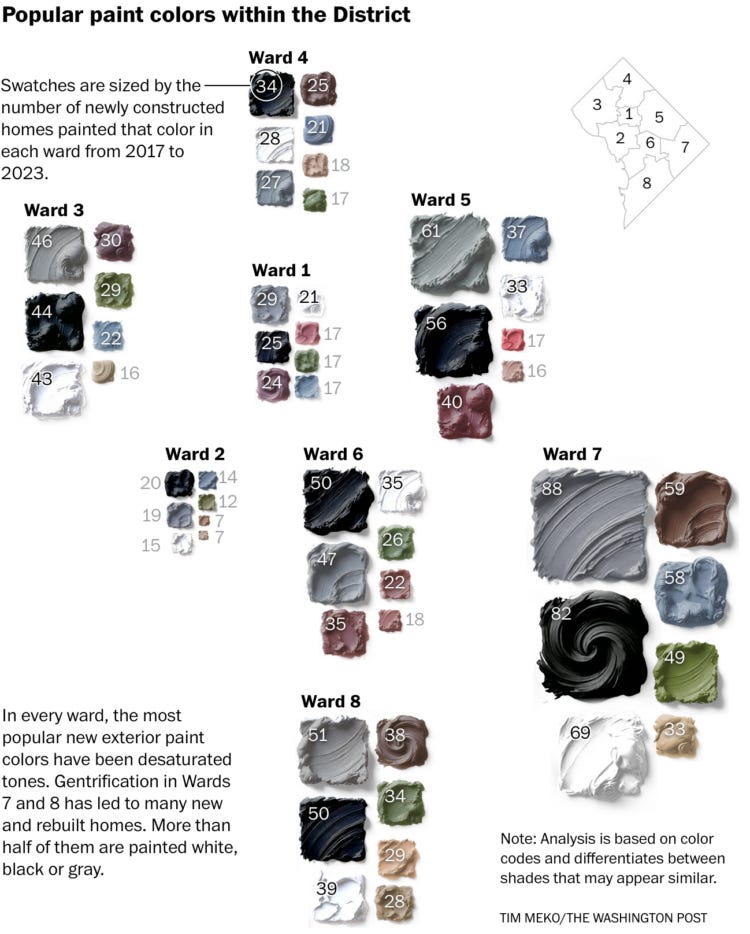
, the Human Mortality Database (2024), and the UN World Population Prospects (2024). The chart is published by Our World in Data, under a CC-BY license by author Saloni Dattani.")