
DataViz Comics, Cities Taxonomy and Data teams structure
🚀 last week could findings, educational materials and visualisations

Cool Findings
The Power of Comics in Dataviz by Shazeera Ahmad

Mapzilla – projects by Craig Taylor

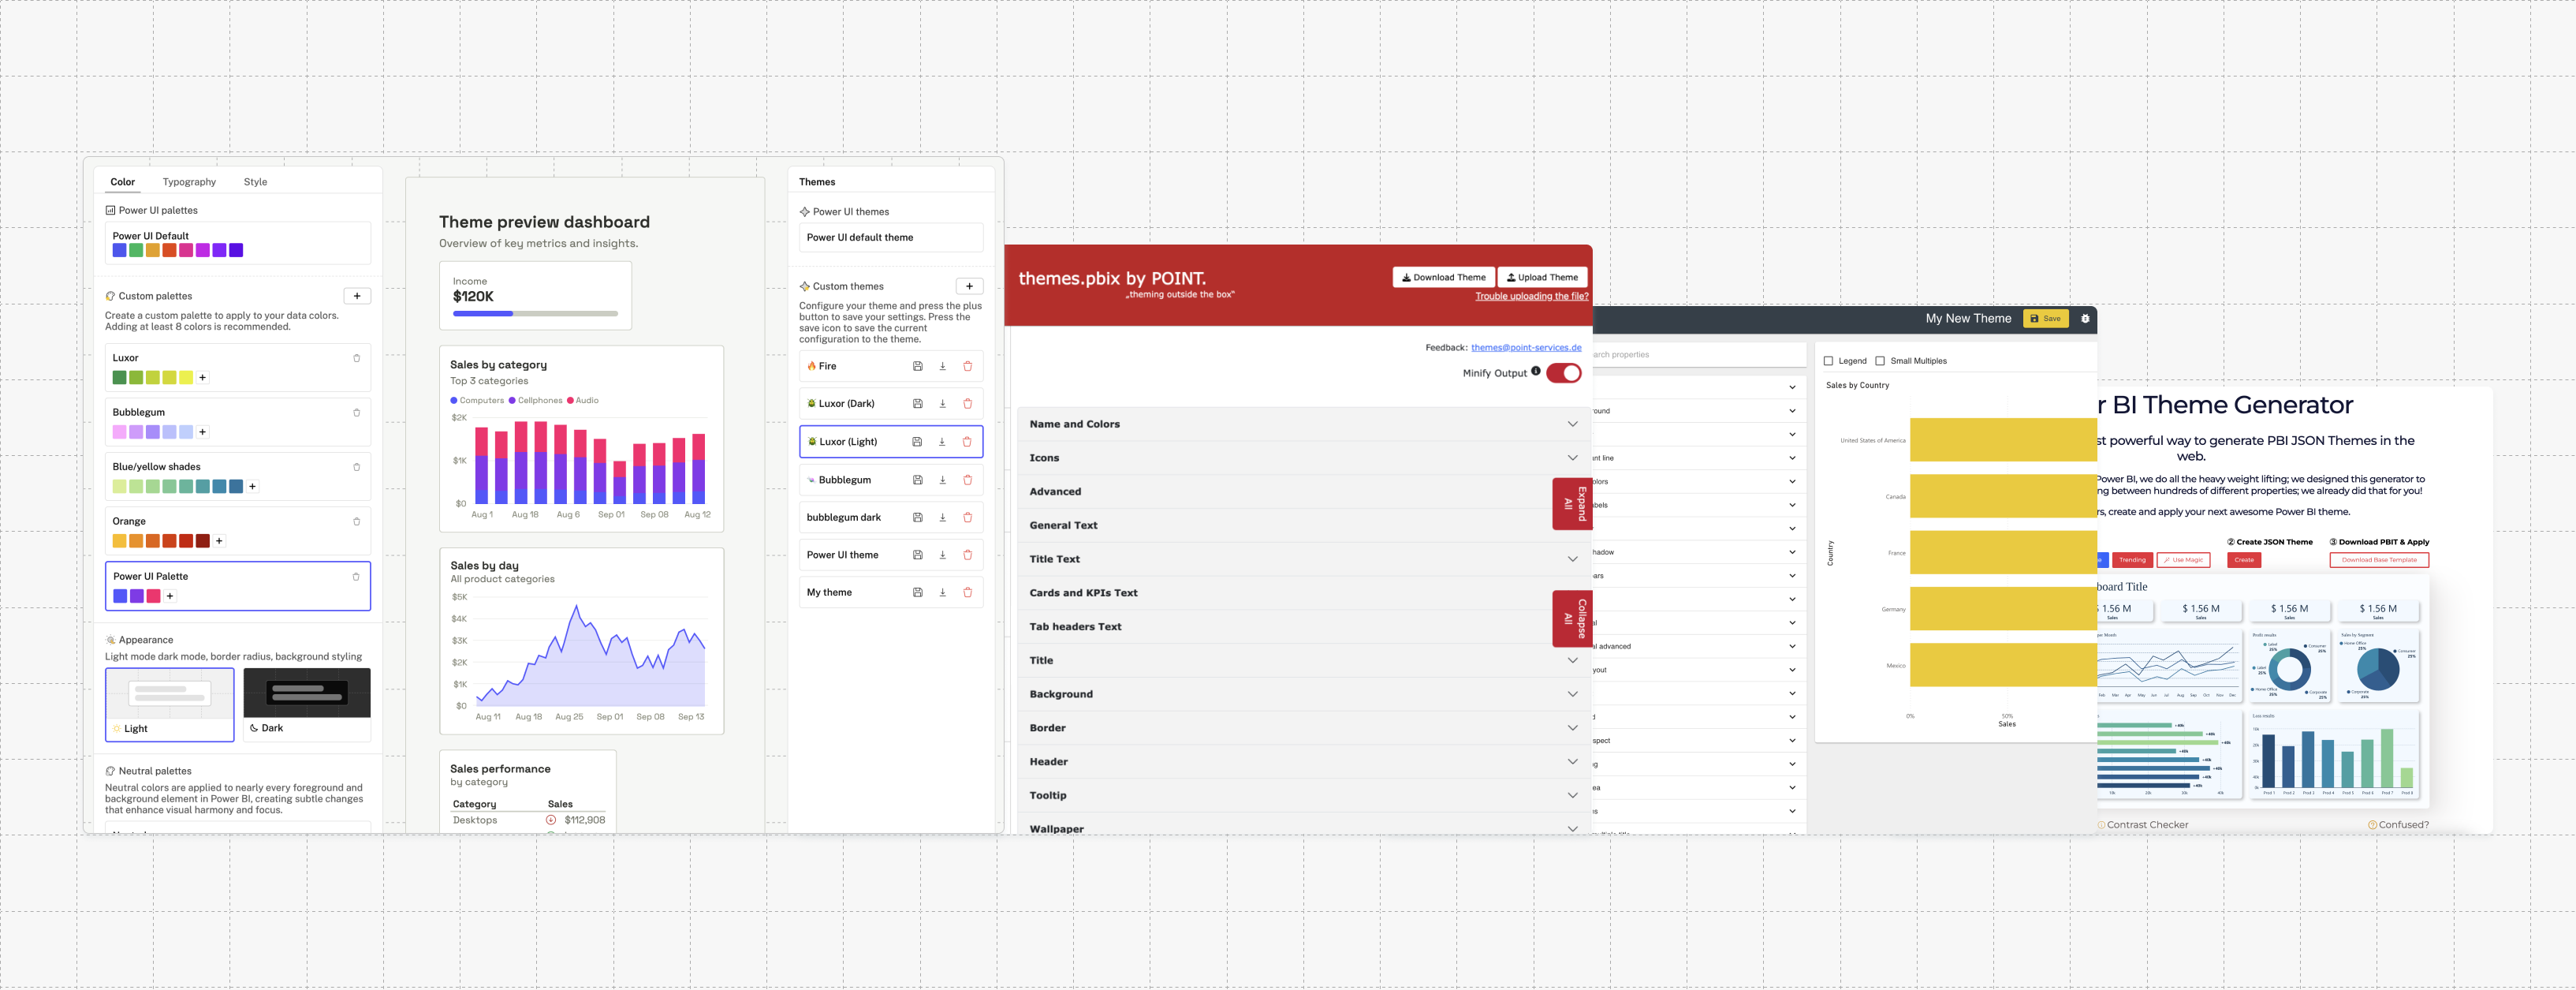
The Best Power BI Theme Generators by PowerUI


Data
How top data teams are structured. A deep dive into the ratio of data roles across insight, data engineering, and machine learning by Mikkel Dengsøe
Educational and Useful
Power BI Documentation for Metrics Descriptions by Lukas Reese
6-week Free Data Engineering Boot Camp by Data with Zach. Started 15th of November.
False Positives: The Imposter Syndrome in Dataviz or “Is imposter syndrome even curable?“ by Datacitron
How To Spot Misleading Charts: Review the Message by Sue Kraemer
Tableau : 25 Date Calculations to build Dynamic KPIs by Yash Sakhuja
Dashboard Picks
Foodie Finds in Bengaluru by Pradeep Kumar G

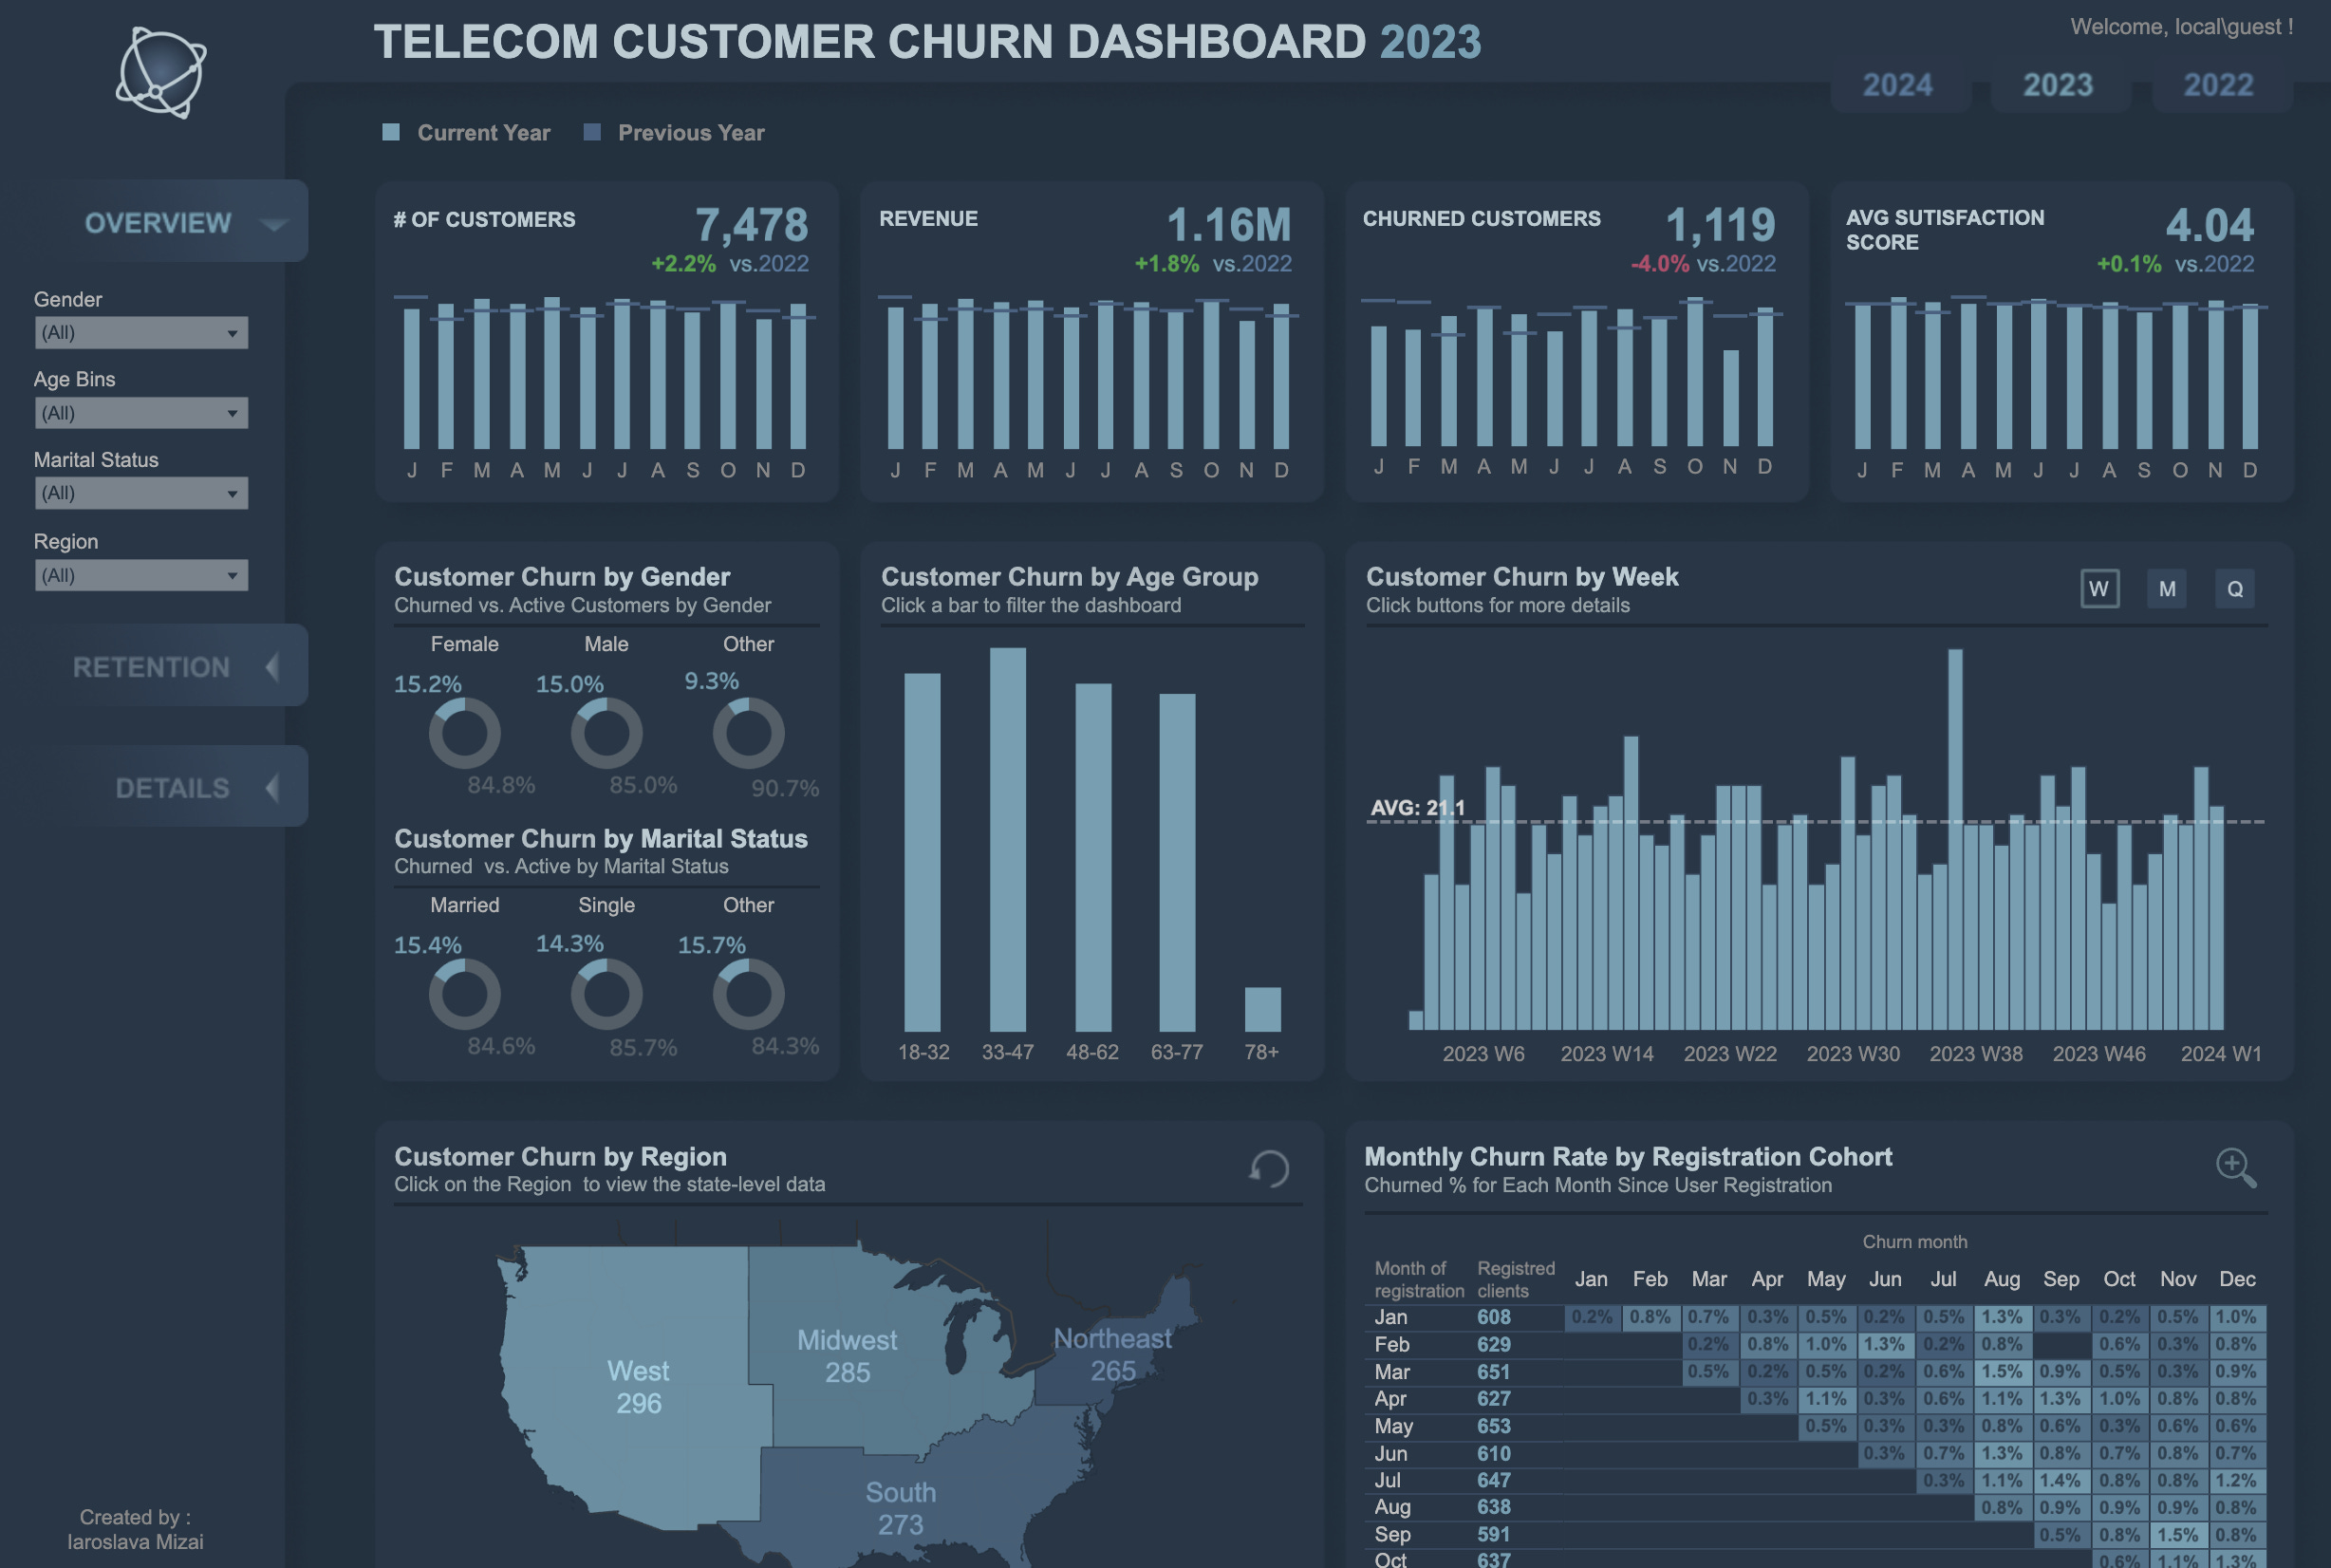
Consultant Performance Dashboard - Lagos TUG Bootcamp Week 1 by Gbolahan Adebayo


Data Visualization Picks


Comics! 😍😍😍